Datastream
Visualizing U.S. Household Debt, by Generation

Introducing our new index, which ranks U.S. generations on their economic, political, and cultural influence.


The Briefing
- Generation X is the most indebted generation on average, with $140,643 of household debt
- Younger generations are witnessing their debts growing at a greater pace relative to older Americans
Visualizing U.S. Household Debt, by Generation
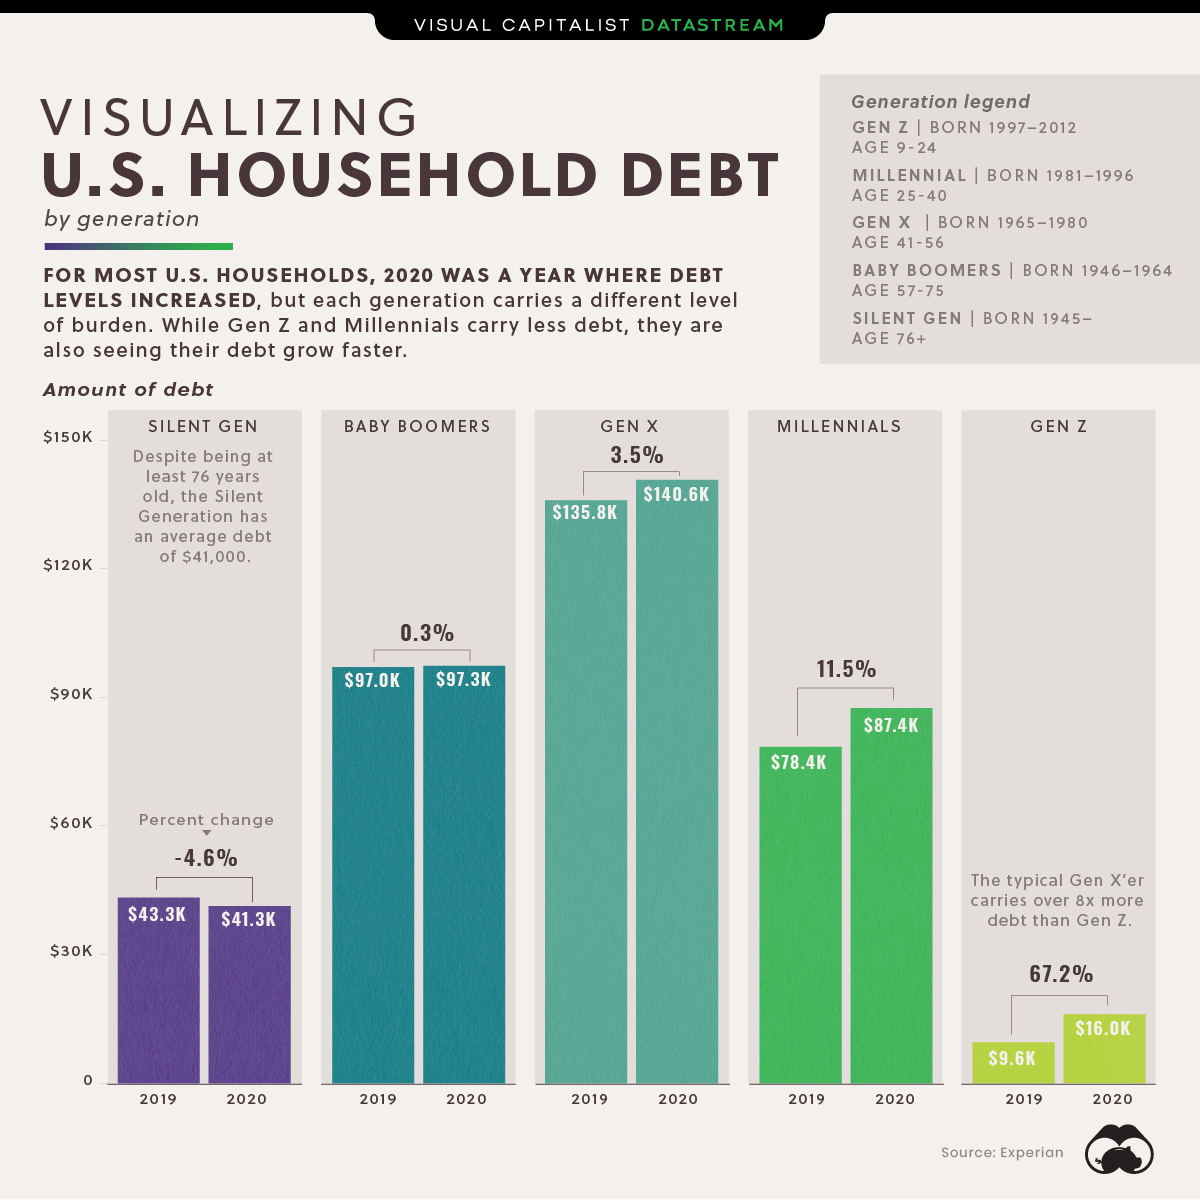
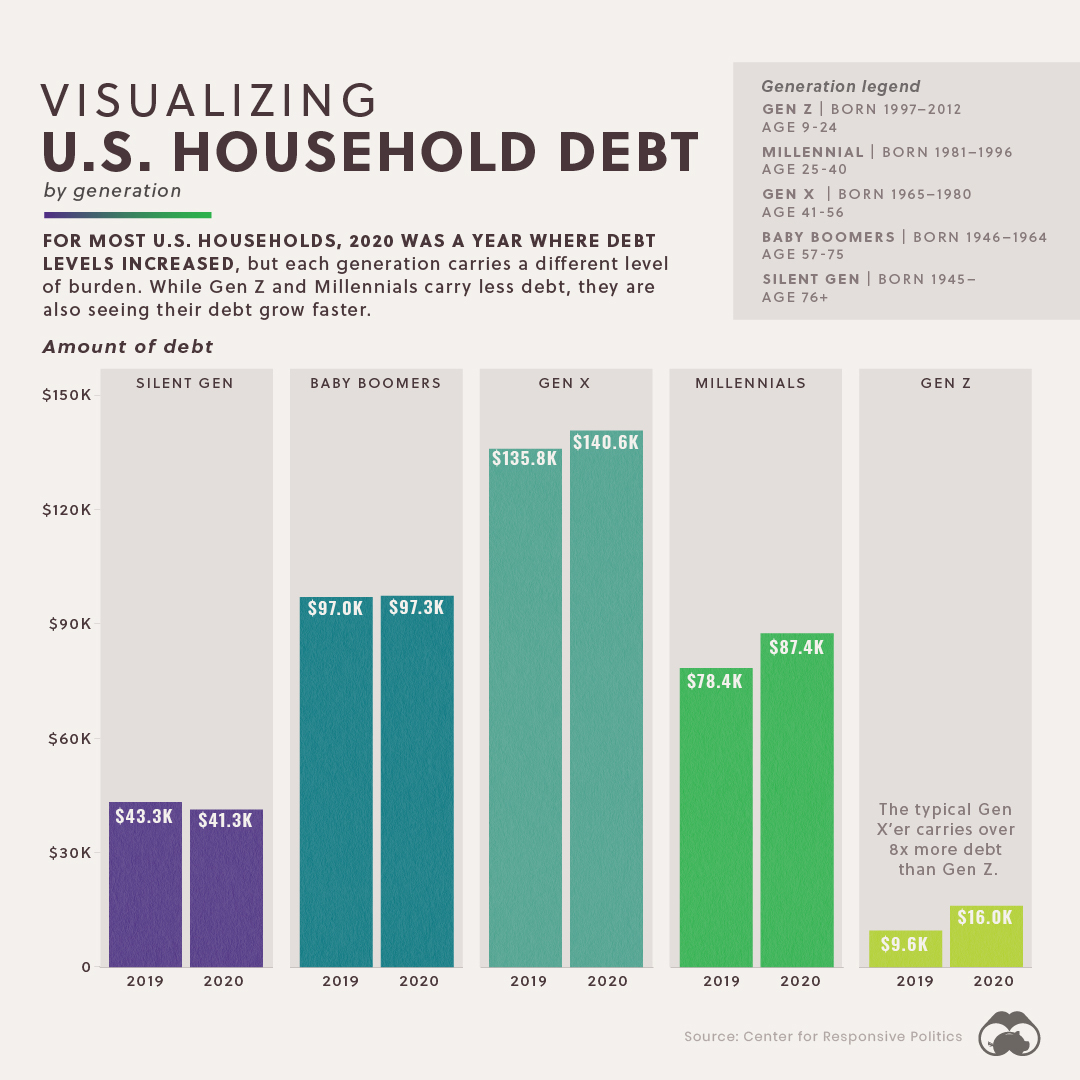
The year 2020 could be categorized as one where debt grew across the board. In the U.S., every generation except the Silent Generation saw their debts rise in the last year.
But how much debt does each generational household owe?
| Generation | 2019 | 2020 | Growth (%) |
|---|---|---|---|
| Generation Z (18-24) | $9,593 | $16,043 | 67.2% |
| Millennials (25-40) | $78,396 | $87,448 | 11.5% |
| Generation X (41-56) | $135,841 | $140,643 | 3.5% |
| Baby Boomers (57-75) | $96,984 | $97,290 | 0.3% |
| Silent Generation (76+) | $43,255 | $41,281 | -4.6% |
Gen X are the most indebted Americans followed by the Baby Boomers. The breakdown of debt by age group suggests the typical American’s debts grow with adulthood to a certain age, at which point it begins to taper off.
Download the Generational Power Report (.pdf)

Digging Deeper
The types of debt vary in significance for each generation. For instance, the leading source of debt for Gen Z and Millennials are student loans (20%) and credit card bills (25%), respectively. Mortgages on the other hand, are the leading source of debt for Gen X (30%) and Baby Boomers (28%).
Collectively, American households have a debt pile of $14.5 trillion, with mortgages representing the majority, at 70%.
Here’s how home mortgages by generation breaks down.
| Generation | Portion of Mortgage Debt |
|---|---|
| Silent Generation | 4.8% |
| Baby Boomers | 29.0% |
| Generation X | 42.0% |
| Millennials | 24.2% |
| Generation Z | - |
Given mortgages represent the largest slice and that Gen X is the most indebted household, it stands to reason that at 42%, Gen X carries the most mortgage debt out of any generation.
Editor’s note: It should be mentioned that the Federal Reserve is yet to include Gen Z in some of their data.
Zooming Out
Though debts are rising for most U.S. households, they still pale in comparison to other countries. Here’s how household U.S. debt ranks on the international stage.
| Country / Territory | Household Debt to GDP (September 2020) |
|---|---|
| 🇨🇭 Switzerland | 131% |
| 🇦🇺 Australia | 122% |
| 🇳🇴 Norway | 112% |
| 🇩🇰 Denmark | 112% |
| 🇨🇦 Canada | 110% |
| 🇳🇱 Netherlands | 104% |
| 🇰🇷 South Korea | 101% |
| 🇳🇿 New Zealand | 95% |
| 🇸🇪 Sweden | 93% |
| 🇬🇧 United Kingdom | 89% |
| 🇭🇰 Hong Kong SAR | 88% |
| 🇺🇸 U.S. | 78% |
The U.S. ranks 12th in global household debt to GDP rankings.
In addition to being the largest economy by GDP, America’s GDP per capita remains one of the highest out of major countries, suggesting these high debts by generation are in part offset by high incomes.
Looking Ahead
Increasing debts have been manageable due to a low interest rate environment. This has persisted for well over a decade, and is expected to remain the case for the near future.
Whether this can hold steady in the long run is still largely unknown.
Where does this data come from?
Source: Federal Reserve, Experian
Notes: Household debt to GDP data is as of September 2020


Datastream
Can You Calculate Your Daily Carbon Footprint?
Discover how the average person’s carbon footprint impacts the environment and learn how carbon credits can offset your carbon footprint.


The Briefing
- A person’s carbon footprint is substantial, with activities such as food consumption creating as much as 4,500 g of CO₂ emissions daily.
- By purchasing carbon credits from Carbon Streaming Corporation, you can offset your own emissions and fund positive climate action.
Your Everyday Carbon Footprint
While many large businesses and countries have committed to net-zero goals, it is essential to acknowledge that your everyday activities also contribute to global emissions.
In this graphic, sponsored by Carbon Streaming Corporation, we will explore how the choices we make and the products we use have a profound impact on our carbon footprint.
Carbon Emissions by Activity
Here are some of the daily activities and products of the average person and their carbon footprint, according to Clever Carbon.
| Household Activities & Products | CO2 Emissions (g) |
|---|---|
| 💡 Standard Light Bulb (100 watts, four hours) | 172 g |
| 📱 Mobile Phone Use (195 minutes per day)* | 189 g |
| 👕 Washing Machine (0.63 kWh) | 275 g |
| 🔥 Electric Oven (1.56 kWh) | 675 g |
| ♨️ Tumble Dryer (2.5 kWh) | 1,000 g |
| 🧻 Toilet Roll (2 ply) | 1,300 g |
| 🚿 Hot Shower (10 mins) | 2,000 g |
| 🚙 Daily Commute (one hour, by car) | 3,360 g |
| 🍽️ Average Daily Food Consumption (three meals of 600 calories) | 4,500 g |
| *Phone use based on yearly use of 69kg per the source, Reboxed | |
Your choice of transportation plays a crucial role in determining your carbon footprint. For instance, a 15 km daily commute to work on public transport generates an average of 1,464 g of CO₂ emissions. Compared to 3,360 g—twice the volume for a journey the same length by car.
By opting for more sustainable modes of transport, such as cycling, walking, or public transportation, you can significantly reduce your carbon footprint.
Addressing Your Carbon Footprint
One way to compensate for your emissions is by purchasing high-quality carbon credits.
Carbon credits are used to help fund projects that avoid, reduce or remove CO₂ emissions. This includes nature-based solutions such as reforestation and improved forest management, or technology-based solutions such as the production of biochar and carbon capture and storage (CCS).
While carbon credits offer a potential solution for individuals to help reduce global emissions, public awareness remains a significant challenge. A BCG-Patch survey revealed that only 34% of U.S. consumers are familiar with carbon credits, and only 3% have purchased them in the past.
About Carbon Streaming
By financing the creation or expansion of carbon projects, Carbon Streaming Corporation secures the rights to future carbon credits generated by these sustainable projects. You can then purchase these carbon credits to help fund climate solutions around the world and compensate for your own emissions.
Ready to get involved?
>> Learn more about purchasing carbon credits at Carbon Streaming

-

 Science1 week ago
Visualizing the Average Lifespans of Mammals
-

 Markets2 weeks ago
The Top 10 States by Real GDP Growth in 2023
-

 Demographics2 weeks ago
The Smallest Gender Wage Gaps in OECD Countries
-

 United States2 weeks ago
Where U.S. Inflation Hit the Hardest in March 2024
-

 Green2 weeks ago
Top Countries By Forest Growth Since 2001
-

 United States2 weeks ago
Ranked: The Largest U.S. Corporations by Number of Employees
-

 Maps2 weeks ago
The Largest Earthquakes in the New York Area (1970-2024)
-

 Green2 weeks ago
Ranked: The Countries With the Most Air Pollution in 2023