

U.S. debt interest payments have surged past the $1 trillion dollar mark, amid high interest rates and an ever-expanding debt burden.


We've visualized data from the Federal Reserve to provide a comprehensive break down of U.S. assets by generation.


Can you picture what $31.4 trillion looks like? This graphic stacks up $1 bills to visualize U.S. debt in physical form.


After a borrowing spree during COVID-19, younger Americans are struggling to keep up with their auto loan payments.


The majority of U.S. households saw debts rise in 2020. This data looks at the growth in household debt and the existing debt pile, by generation
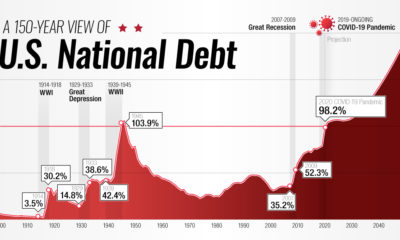

This interactive visual shows how the U.S. national debt has fluctuated since 1900, as well as projections all the way to 2050.
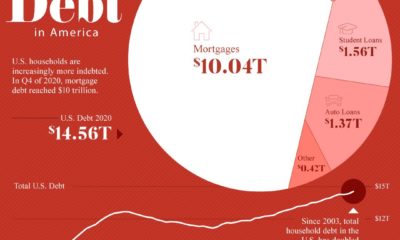

Since 2003, U.S. household debt has doubled to over $14.5 trillion. We break down the components of this colossal figure.


More than $6 trillion of U.S. debt is owned by foreign governments such as China or Japan. See how it all breaks down, and what it...
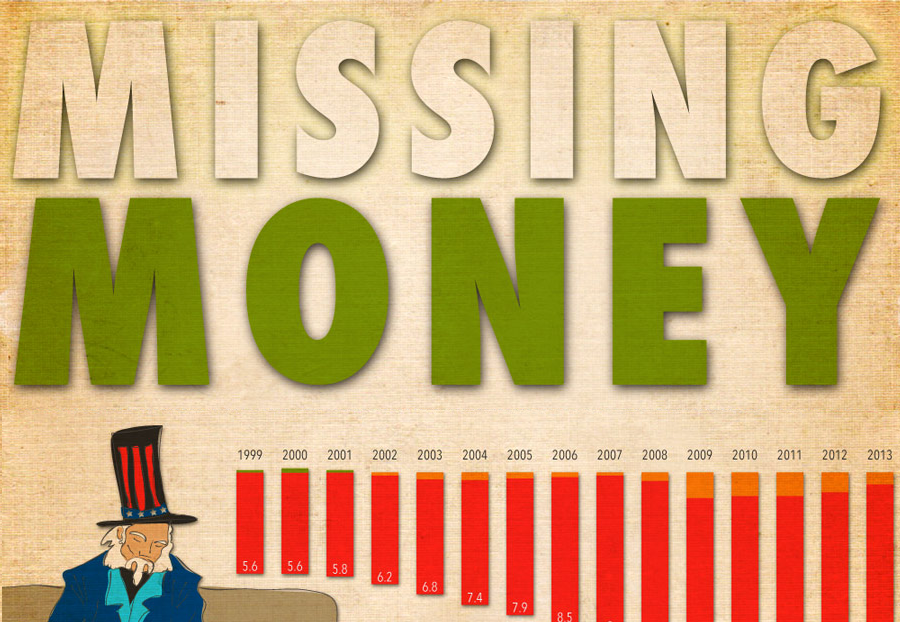
Missing Money: Uncle Sam’s Accounting is Suspect For some time now, the Government of the United States has been effectively checking through their couch for loose...


 Creator Program