Markets
Which Countries Own the Most U.S. Debt?
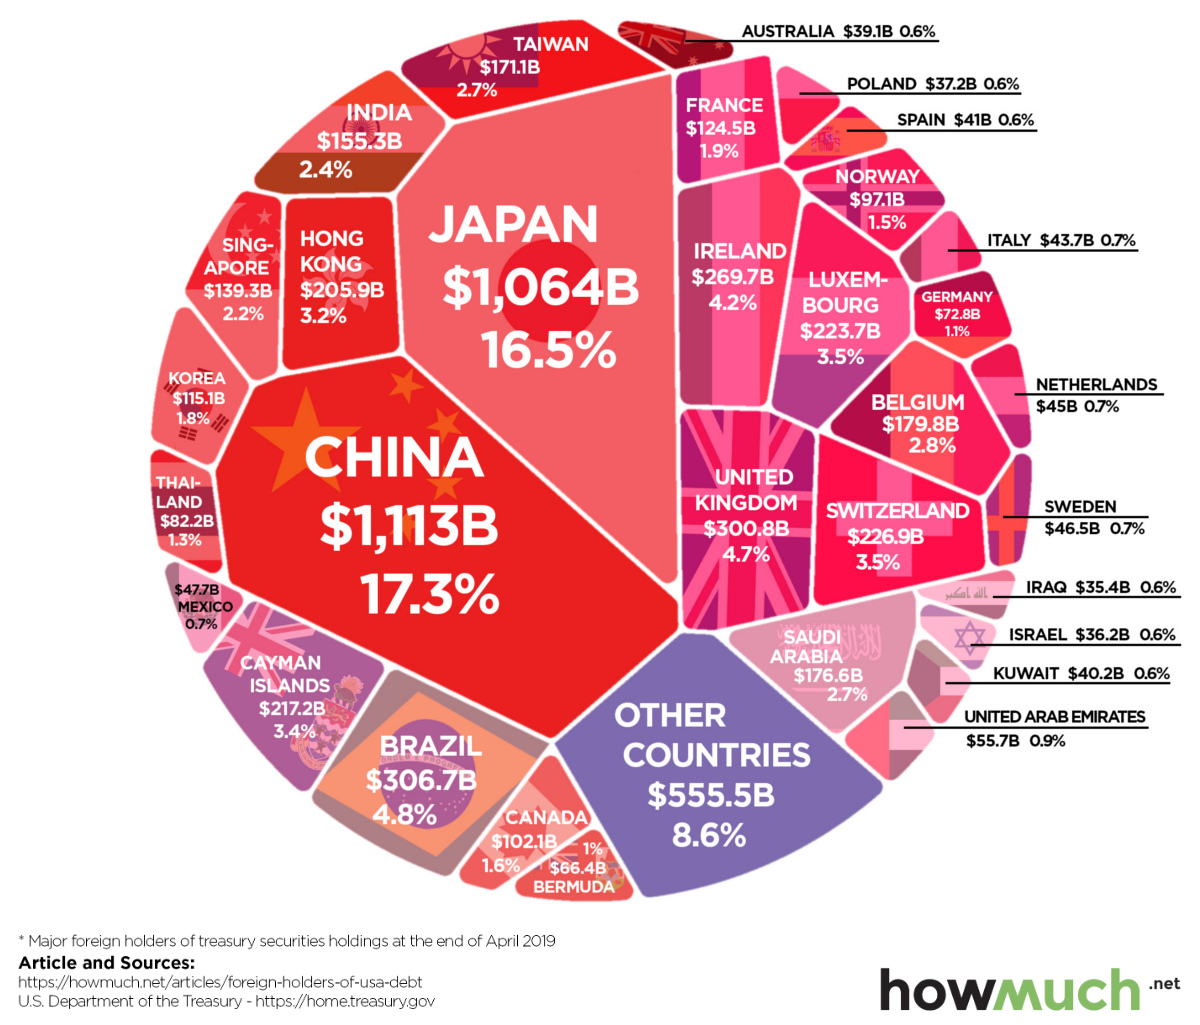
The Foreign Countries Holding the Most U.S. Debt
In the international finance system, U.S. debt can be bought and held by virtually anyone.
In fact, if you hold a U.S. Treasury bond or a T-Bill in your portfolio right now, you are already a creditor to the United States government.
And as you can see in today’s chart from HowMuch.net, foreign countries like China and Japan can also accumulate large positions in U.S. Treasurys, making them significant players in the overall United States debt pie.
U.S. Debt: The Big Picture
The United States federal debt currently sits at $22 trillion, and it’s held by a range of domestic and foreign investors.
| Entity | Debt Holdings | Share of Total |
|---|---|---|
| U.S. Government and Federal Reserve | $8.1 trillion | 36.8% |
| Foreign and international | $6.3 trillion | 28.5% |
| Mutual funds | $2.06 trillion | 9.4% |
| Pension funds | $0.92 trillion | 4.2% |
| Banks | $0.77 trillion | 3.5% |
| State and local governments | $0.69 trillion | 3.1% |
| Other investors | $3.18 trillion | 14.5% |
| Total | $21.97 trillion | 100.0% |
As you can see, about $8.1 trillion of debt is held by departments of the U.S. government or the Federal Reserve. This number would include securities sitting in retirement accounts of federal employees, social security trust funds, or any of the Treasurys sitting on the Fed’s balance sheet.
Next, another $7.6 trillion of debt is held by domestic investors. These are marketable securities held by banks, mutual funds, pension funds, insurance companies, and other investors.
While debt held domestically is mostly uninteresting, a bigger question mark is the $6.3 trillion of debt that is owned by foreign countries. After all, couldn’t a country like China “weaponize” its large holdings of Treasury securities as a form of retaliation in the ongoing trade war?
Foreign Owners of the Debt
Internationally, the biggest owners of debt include China and Japan, each with over $1 trillion.
| Rank | Country | U.S. Debt Holdings | Percentage of Foreign U.S. Debt Held (%) |
|---|---|---|---|
| #1 | 🇨🇳 China | $1.11 trillion | 17.3% |
| #2 | 🇯🇵 Japan | $1.06 trillion | 16.5% |
| #3 | 🇧🇷 Brazil | $307 billion | 4.8% |
| #4 | 🇬🇧 United Kingdom | $301 billion | 4.7% |
| #5 | 🇮🇪 Ireland | $270 billion | 4.2% |
| #6 | 🇨🇭 Switzerland | $227 billion | 3.5% |
| #7 | 🇱🇺 Luxembourg | $224 billion | 3.5% |
| #8 | 🇰🇾 Cayman Islands | $217 billion | 3.4% |
| #9 | 🇭🇰 Hong Kong | $206 billion | 3.2% |
| #10 | 🇧🇪 Belgium | $180 billion | 2.8% |
| #11 | 🇸🇦 Saudi Arabia | $177 billion | 2.8% |
| #12 | 🇹🇼 Taiwan | $171 billion | 2.7% |
Why does China hold so much of the foreign-owned U.S. debt?
China has accumulated Treasury securities over decades, as part of its strategy to keep its domestic currency from strengthening. Interestingly, the export-heavy nation has reduced its swath of Treasurys in recent months, selling off close to $200 billion of them.
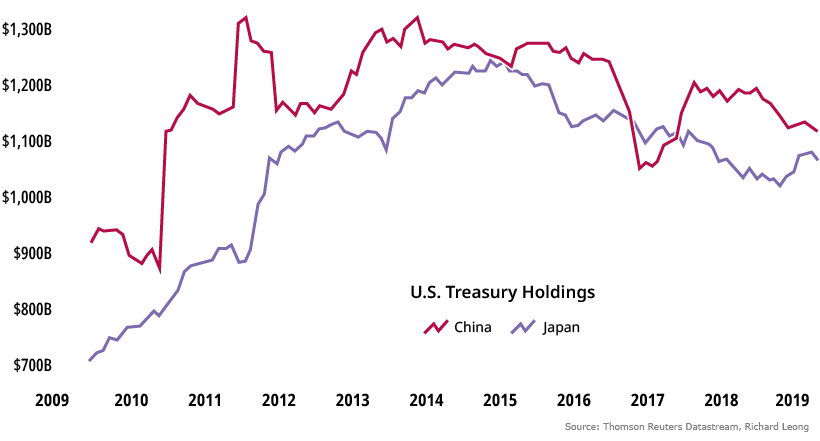
Although China has $1.11 trillion of Treasurys left in reserve, the general consensus is that dumping all of them at once would destabilize the global financial system, having an equally negative effect on China as well.
That said, with foreign nations holding U.S. debt, such a risk will always exist.
Gimme Shelter
While it’s not surprising to see countries like China, Japan, or Brazil on the list of top foreign debt holders, what are places like the Cayman Islands, Luxembourg, or Ireland doing on the list?
Two simple facts help to explain these anomalies.
Firstly, despite having a population of just 60,000 people, the Cayman Islands is a hedge fund capital with over 10,000 funds domiciled there. Luxembourg makes the list for similar reasons, given that it is the European-based tax shelter equivalent.
Ireland, on the other hand, is the overseas headquarters for many U.S.-based tech giants like Facebook or Alphabet. Apparently, these corporations like to hold their overseas profits in highly-liquid Treasurys, rather than paying a repatriation tax to bring the cash back to American soil.


Markets
The European Stock Market: Attractive Valuations Offer Opportunities
On average, the European stock market has valuations that are nearly 50% lower than U.S. valuations. But how can you access the market?


European Stock Market: Attractive Valuations Offer Opportunities
Europe is known for some established brands, from L’Oréal to Louis Vuitton. However, the European stock market offers additional opportunities that may be lesser known.
The above infographic, sponsored by STOXX, outlines why investors may want to consider European stocks.
Attractive Valuations
Compared to most North American and Asian markets, European stocks offer lower or comparable valuations.
| Index | Price-to-Earnings Ratio | Price-to-Book Ratio |
|---|---|---|
| EURO STOXX 50 | 14.9 | 2.2 |
| STOXX Europe 600 | 14.4 | 2 |
| U.S. | 25.9 | 4.7 |
| Canada | 16.1 | 1.8 |
| Japan | 15.4 | 1.6 |
| Asia Pacific ex. China | 17.1 | 1.8 |
Data as of February 29, 2024. See graphic for full index names. Ratios based on trailing 12 month financials. The price to earnings ratio excludes companies with negative earnings.
On average, European valuations are nearly 50% lower than U.S. valuations, potentially offering an affordable entry point for investors.
Research also shows that lower price ratios have historically led to higher long-term returns.
Market Movements Not Closely Connected
Over the last decade, the European stock market had low-to-moderate correlation with North American and Asian equities.
The below chart shows correlations from February 2014 to February 2024. A value closer to zero indicates low correlation, while a value of one would indicate that two regions are moving in perfect unison.
| EURO STOXX 50 | STOXX EUROPE 600 | U.S. | Canada | Japan | Asia Pacific ex. China |
|
|---|---|---|---|---|---|---|
| EURO STOXX 50 | 1.00 | 0.97 | 0.55 | 0.67 | 0.24 | 0.43 |
| STOXX EUROPE 600 | 1.00 | 0.56 | 0.71 | 0.28 | 0.48 | |
| U.S. | 1.00 | 0.73 | 0.12 | 0.25 | ||
| Canada | 1.00 | 0.22 | 0.40 | |||
| Japan | 1.00 | 0.88 | ||||
| Asia Pacific ex. China | 1.00 |
Data is based on daily USD returns.
European equities had relatively independent market movements from North American and Asian markets. One contributing factor could be the differing sector weights in each market. For instance, technology makes up a quarter of the U.S. market, but health care and industrials dominate the broader European market.
Ultimately, European equities can enhance portfolio diversification and have the potential to mitigate risk for investors.
Tracking the Market
For investors interested in European equities, STOXX offers a variety of flagship indices:
| Index | Description | Market Cap |
|---|---|---|
| STOXX Europe 600 | Pan-regional, broad market | €10.5T |
| STOXX Developed Europe | Pan-regional, broad-market | €9.9T |
| STOXX Europe 600 ESG-X | Pan-regional, broad market, sustainability focus | €9.7T |
| STOXX Europe 50 | Pan-regional, blue-chip | €5.1T |
| EURO STOXX 50 | Eurozone, blue-chip | €3.5T |
Data is as of February 29, 2024. Market cap is free float, which represents the shares that are readily available for public trading on stock exchanges.
The EURO STOXX 50 tracks the Eurozone’s biggest and most traded companies. It also underlies one of the world’s largest ranges of ETFs and mutual funds. As of November 2023, there were €27.3 billion in ETFs and €23.5B in mutual fund assets under management tracking the index.
“For the past 25 years, the EURO STOXX 50 has served as an accurate, reliable and tradable representation of the Eurozone equity market.”
— Axel Lomholt, General Manager at STOXX
Partnering with STOXX to Track the European Stock Market
Are you interested in European equities? STOXX can be a valuable partner:
- Comprehensive, liquid and investable ecosystem
- European heritage, global reach
- Highly sophisticated customization capabilities
- Open architecture approach to using data
- Close partnerships with clients
- Part of ISS STOXX and Deutsche Börse Group
With a full suite of indices, STOXX can help you benchmark against the European stock market.
Learn how STOXX’s European indices offer liquid and effective market access.

-

 Economy3 days ago
Economic Growth Forecasts for G7 and BRICS Countries in 2024
The IMF has released its economic growth forecasts for 2024. How do the G7 and BRICS countries compare?
-

 Markets2 weeks ago
U.S. Debt Interest Payments Reach $1 Trillion
U.S. debt interest payments have surged past the $1 trillion dollar mark, amid high interest rates and an ever-expanding debt burden.
-

 United States2 weeks ago
Ranked: The Largest U.S. Corporations by Number of Employees
We visualized the top U.S. companies by employees, revealing the massive scale of retailers like Walmart, Target, and Home Depot.
-

 Markets2 weeks ago
The Top 10 States by Real GDP Growth in 2023
This graphic shows the states with the highest real GDP growth rate in 2023, largely propelled by the oil and gas boom.
-

 Markets2 weeks ago
Ranked: The World’s Top Flight Routes, by Revenue
In this graphic, we show the highest earning flight routes globally as air travel continued to rebound in 2023.
-

 Markets3 weeks ago
Ranked: The Most Valuable Housing Markets in America
The U.S. residential real estate market is worth a staggering $47.5 trillion. Here are the most valuable housing markets in the country.


-

 Debt1 week ago
How Debt-to-GDP Ratios Have Changed Since 2000
-
Markets2 weeks ago
Ranked: The World’s Top Flight Routes, by Revenue
-

 Countries2 weeks ago
Population Projections: The World’s 6 Largest Countries in 2075
-
Markets2 weeks ago
The Top 10 States by Real GDP Growth in 2023
-

 Demographics2 weeks ago
The Smallest Gender Wage Gaps in OECD Countries
-

 United States2 weeks ago
Where U.S. Inflation Hit the Hardest in March 2024
-

 Green2 weeks ago
Top Countries By Forest Growth Since 2001
-
United States2 weeks ago
Ranked: The Largest U.S. Corporations by Number of Employees