Markets
A Short History of U.S. Trade Wars
Infographic: A Short History of U.S. Trade Wars
The Chart of the Week is a weekly Visual Capitalist feature on Fridays.
History is full of trade wars.
In the majority of cases, the consequences are mostly economic – trade barriers are enacted, and then retaliatory measures are used to counter. Relations can continue to escalate until an understanding can be reached by both parties.
In the minority of cases, trade wars can lead to world-changing consequences.
You may remember that the Boston Tea Party of 1773 was a bold response to an unfair trade measure imposed by a ruling power, and it proved to be a key catalyst that led to the American Revolution.
Meanwhile, the Opium Wars occurred after the Qing Dynasty (China) tried to prevent British merchants from selling opium to the Chinese in the 1830s. These trade barriers led to armed conflicts, and effectively put the nail in the coffin of the Qing Dyasty – the start of China’s infamous “century of humiliation”.
U.S. Trade Wars
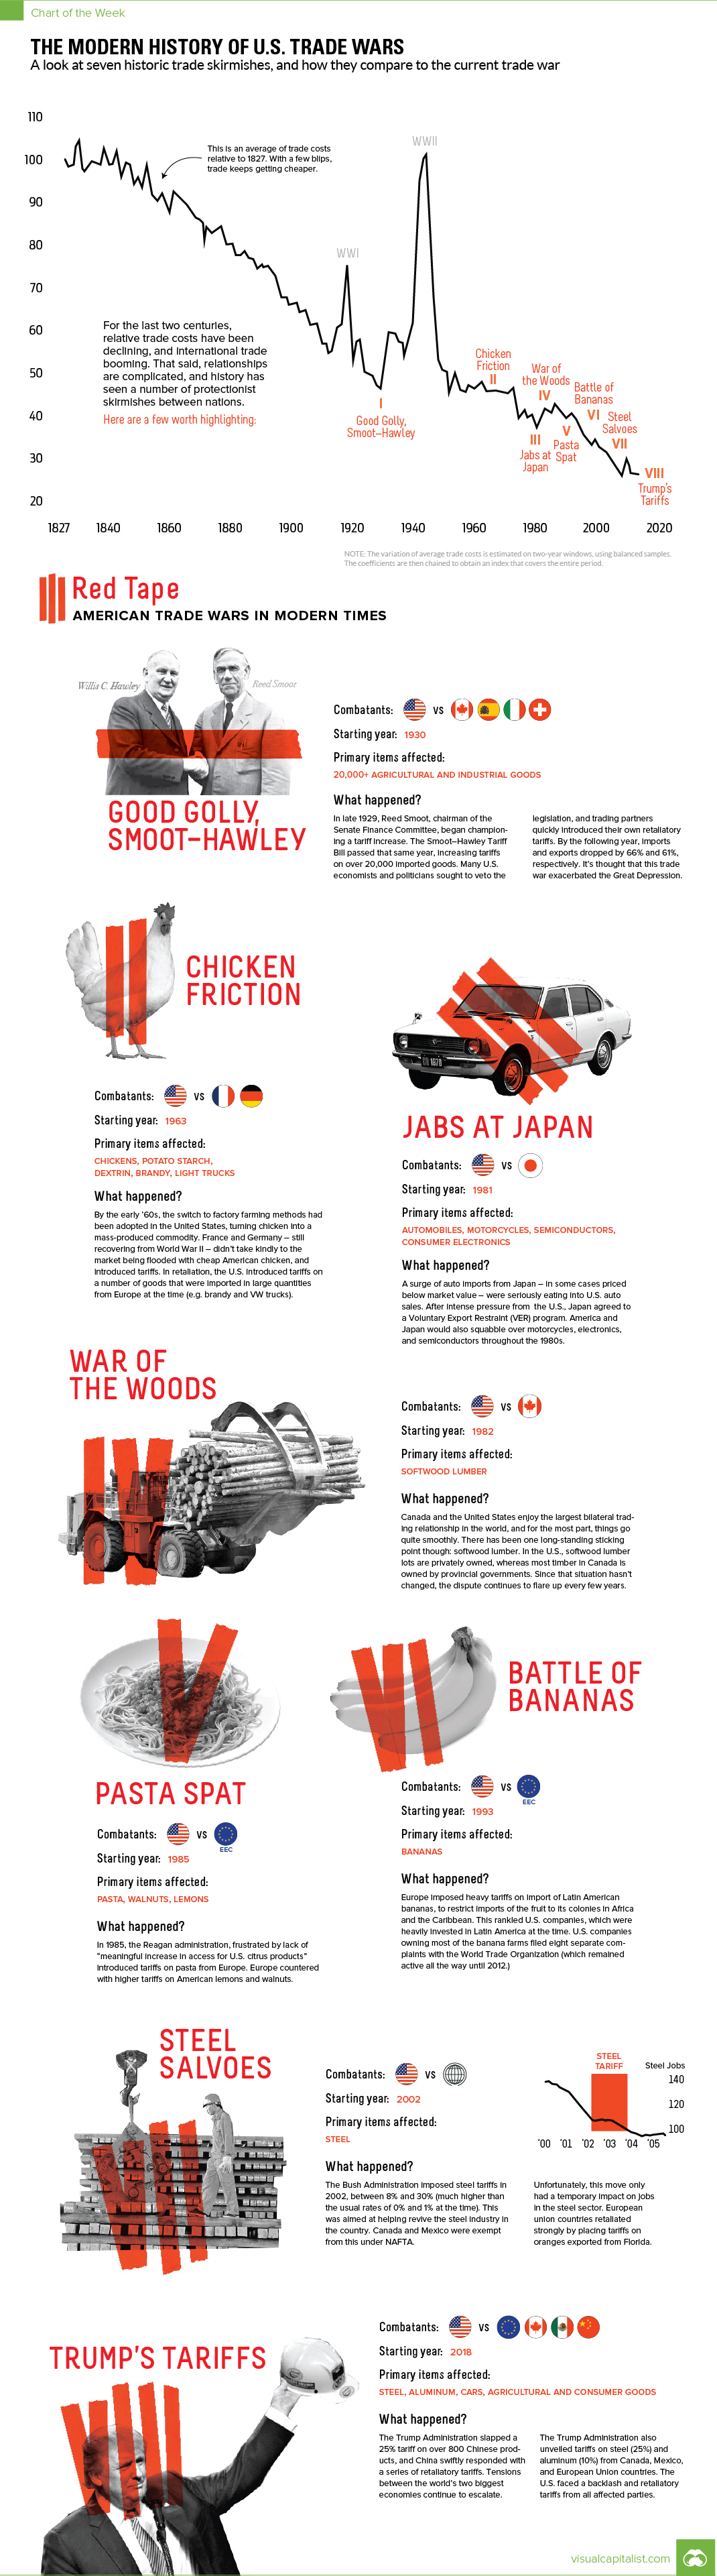
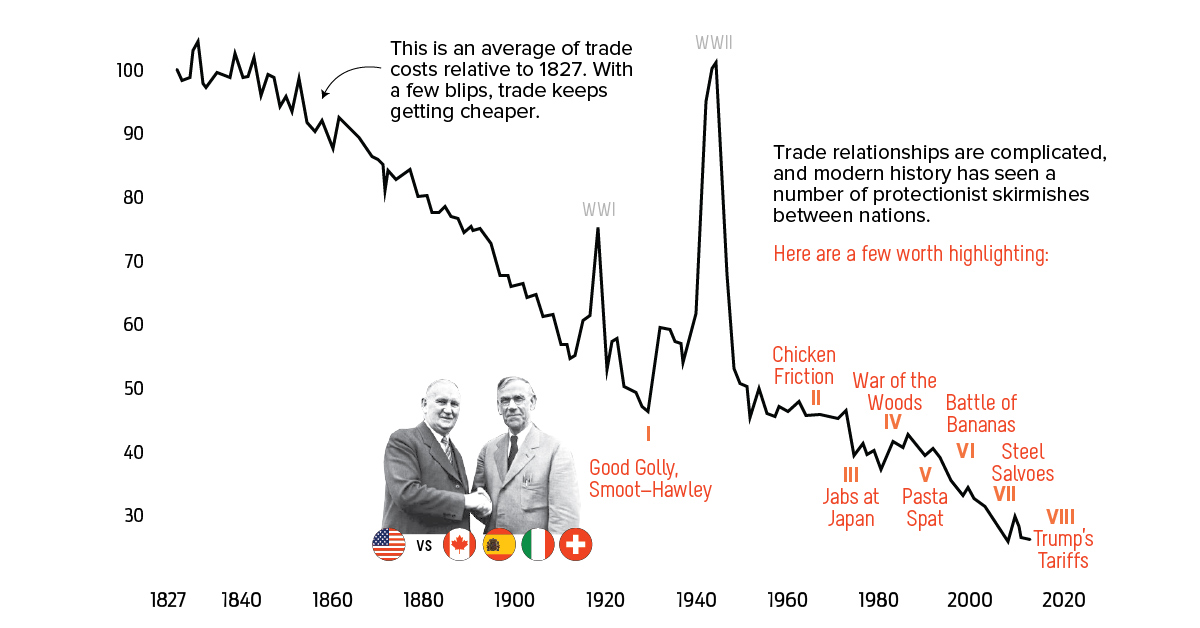
Today’s chart pulls together details on some of the biggest trade conflicts in modern U.S. history.
Here are some of the more interesting U.S. trade wars, and how they compare to the current spat that is evolving with major trade partners:
1. Smoot-Hawley, 1930
Imposed during The Great Depression, the Smoot-Hawley Act is almost universally recognized by economists and economic historians as triggering a trade war that exacerbated the recovery.
2. Chicken Friction, 1963
Factory farming of chicken in the U.S. ended up catching European farmers off guard. French and German authorities responded by imposing tariffs, and the U.S. then taxed imports such as trucks and brandy.
3. Jabs at Japan, 1981
Japan’s mid-century rise led to the country becoming an export powerhouse. As Japanese cars flooded the U.S. market, intense pressure eventually led to the signing of a Voluntary Export Restraint (VER) agreement that limited sales in the United States. During this same timeframe, the two countries also squabbled about other goods like electronics, motorcycles, and semiconductors.
4. War of the Woods, 1982
The Canada-U.S. Softwood Lumber dispute kicked off in 1982, but it inevitably resurfaces in the news every few years.
5. Pasta Spat, 1985
The U.S. was displeased with the level of access for citrus products in Europe, and put a tariff on pasta products. Europe retaliated by taxing walnuts and lemons from the States.
6. Battle of the Bananas, 1993
Another agricultural trade war, the Battle of the Bananas occurred after Europe slapped tariffs on the import of Latin American bananas. Many of these companies, owned by Americans, were not impressed. In response, there were eight separate complaints filed to the World Trade Organization (WTO). They weren’t resolved until 2012.
7. Steel Salvoes, 2002
These were the last major U.S. steel tariffs introduced before the more recent ones. The goal was similar: to revive the steel industry in the country. However, after a period of brief stability, jobs continued to decline. The European Union responded by taxing oranges exported from Florida.


Markets
The European Stock Market: Attractive Valuations Offer Opportunities
On average, the European stock market has valuations that are nearly 50% lower than U.S. valuations. But how can you access the market?


European Stock Market: Attractive Valuations Offer Opportunities
Europe is known for some established brands, from L’Oréal to Louis Vuitton. However, the European stock market offers additional opportunities that may be lesser known.
The above infographic, sponsored by STOXX, outlines why investors may want to consider European stocks.
Attractive Valuations
Compared to most North American and Asian markets, European stocks offer lower or comparable valuations.
| Index | Price-to-Earnings Ratio | Price-to-Book Ratio |
|---|---|---|
| EURO STOXX 50 | 14.9 | 2.2 |
| STOXX Europe 600 | 14.4 | 2 |
| U.S. | 25.9 | 4.7 |
| Canada | 16.1 | 1.8 |
| Japan | 15.4 | 1.6 |
| Asia Pacific ex. China | 17.1 | 1.8 |
Data as of February 29, 2024. See graphic for full index names. Ratios based on trailing 12 month financials. The price to earnings ratio excludes companies with negative earnings.
On average, European valuations are nearly 50% lower than U.S. valuations, potentially offering an affordable entry point for investors.
Research also shows that lower price ratios have historically led to higher long-term returns.
Market Movements Not Closely Connected
Over the last decade, the European stock market had low-to-moderate correlation with North American and Asian equities.
The below chart shows correlations from February 2014 to February 2024. A value closer to zero indicates low correlation, while a value of one would indicate that two regions are moving in perfect unison.
| EURO STOXX 50 | STOXX EUROPE 600 | U.S. | Canada | Japan | Asia Pacific ex. China |
|
|---|---|---|---|---|---|---|
| EURO STOXX 50 | 1.00 | 0.97 | 0.55 | 0.67 | 0.24 | 0.43 |
| STOXX EUROPE 600 | 1.00 | 0.56 | 0.71 | 0.28 | 0.48 | |
| U.S. | 1.00 | 0.73 | 0.12 | 0.25 | ||
| Canada | 1.00 | 0.22 | 0.40 | |||
| Japan | 1.00 | 0.88 | ||||
| Asia Pacific ex. China | 1.00 |
Data is based on daily USD returns.
European equities had relatively independent market movements from North American and Asian markets. One contributing factor could be the differing sector weights in each market. For instance, technology makes up a quarter of the U.S. market, but health care and industrials dominate the broader European market.
Ultimately, European equities can enhance portfolio diversification and have the potential to mitigate risk for investors.
Tracking the Market
For investors interested in European equities, STOXX offers a variety of flagship indices:
| Index | Description | Market Cap |
|---|---|---|
| STOXX Europe 600 | Pan-regional, broad market | €10.5T |
| STOXX Developed Europe | Pan-regional, broad-market | €9.9T |
| STOXX Europe 600 ESG-X | Pan-regional, broad market, sustainability focus | €9.7T |
| STOXX Europe 50 | Pan-regional, blue-chip | €5.1T |
| EURO STOXX 50 | Eurozone, blue-chip | €3.5T |
Data is as of February 29, 2024. Market cap is free float, which represents the shares that are readily available for public trading on stock exchanges.
The EURO STOXX 50 tracks the Eurozone’s biggest and most traded companies. It also underlies one of the world’s largest ranges of ETFs and mutual funds. As of November 2023, there were €27.3 billion in ETFs and €23.5B in mutual fund assets under management tracking the index.
“For the past 25 years, the EURO STOXX 50 has served as an accurate, reliable and tradable representation of the Eurozone equity market.”
— Axel Lomholt, General Manager at STOXX
Partnering with STOXX to Track the European Stock Market
Are you interested in European equities? STOXX can be a valuable partner:
- Comprehensive, liquid and investable ecosystem
- European heritage, global reach
- Highly sophisticated customization capabilities
- Open architecture approach to using data
- Close partnerships with clients
- Part of ISS STOXX and Deutsche Börse Group
With a full suite of indices, STOXX can help you benchmark against the European stock market.
Learn how STOXX’s European indices offer liquid and effective market access.

-

 Economy2 days ago
Economic Growth Forecasts for G7 and BRICS Countries in 2024
The IMF has released its economic growth forecasts for 2024. How do the G7 and BRICS countries compare?
-

 Markets1 week ago
U.S. Debt Interest Payments Reach $1 Trillion
U.S. debt interest payments have surged past the $1 trillion dollar mark, amid high interest rates and an ever-expanding debt burden.
-

 United States2 weeks ago
Ranked: The Largest U.S. Corporations by Number of Employees
We visualized the top U.S. companies by employees, revealing the massive scale of retailers like Walmart, Target, and Home Depot.
-

 Markets2 weeks ago
The Top 10 States by Real GDP Growth in 2023
This graphic shows the states with the highest real GDP growth rate in 2023, largely propelled by the oil and gas boom.
-

 Markets2 weeks ago
Ranked: The World’s Top Flight Routes, by Revenue
In this graphic, we show the highest earning flight routes globally as air travel continued to rebound in 2023.
-

 Markets2 weeks ago
Ranked: The Most Valuable Housing Markets in America
The U.S. residential real estate market is worth a staggering $47.5 trillion. Here are the most valuable housing markets in the country.


-

 Mining1 week ago
Gold vs. S&P 500: Which Has Grown More Over Five Years?
-
Markets2 weeks ago
Ranked: The Most Valuable Housing Markets in America
-

 Money2 weeks ago
Which States Have the Highest Minimum Wage in America?
-

 AI2 weeks ago
Ranked: Semiconductor Companies by Industry Revenue Share
-
Markets2 weeks ago
Ranked: The World’s Top Flight Routes, by Revenue
-

 Demographics2 weeks ago
Population Projections: The World’s 6 Largest Countries in 2075
-
Markets2 weeks ago
The Top 10 States by Real GDP Growth in 2023
-

 Demographics2 weeks ago
The Smallest Gender Wage Gaps in OECD Countries