Money
How Long it Took Billionaires to Earn Their First $1 Million
How Long it Took Billionaires to Earn Their First $1 Million
Everyone has to start somewhere.
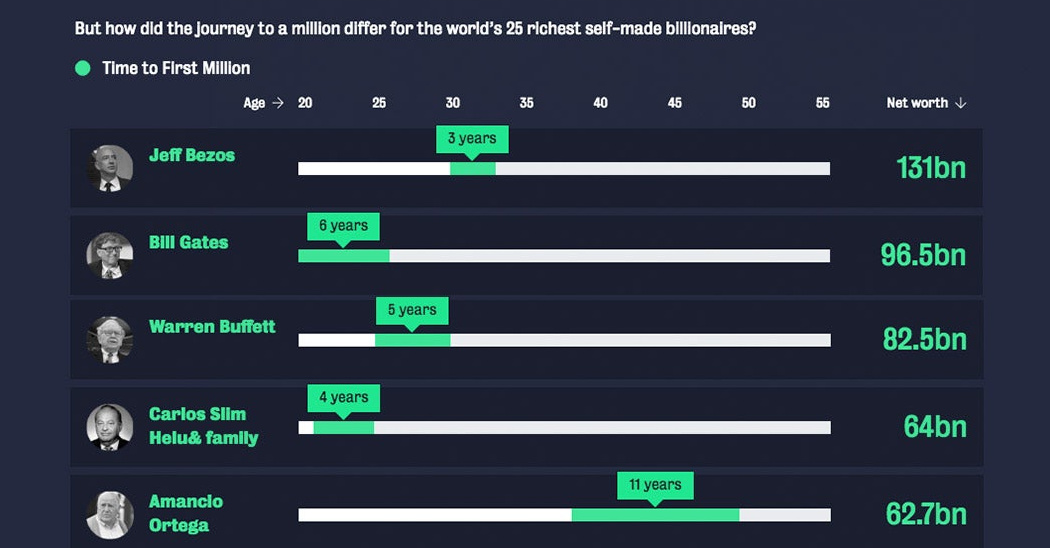
While the modern fortunes of people like Jeff Bezos and Bill Gates seem stratospheric in size, even the world’s richest self-made billionaires had to crawl before they could walk.
After all, the journey to becoming ultra-wealthy hinges on earning that very first $1 million – the initial pillar of wealth that helps provide the security and confidence to go all-in on later ventures and investments.
The Typical Journey
Today’s infographic comes to us from Slotsia, and it compares the timelines of the wealthiest self-made billionaires showing how long it took them to each earn their first $1 million.
As it turns out, joining the Two Comma Club is rarely an overnight endeavor.
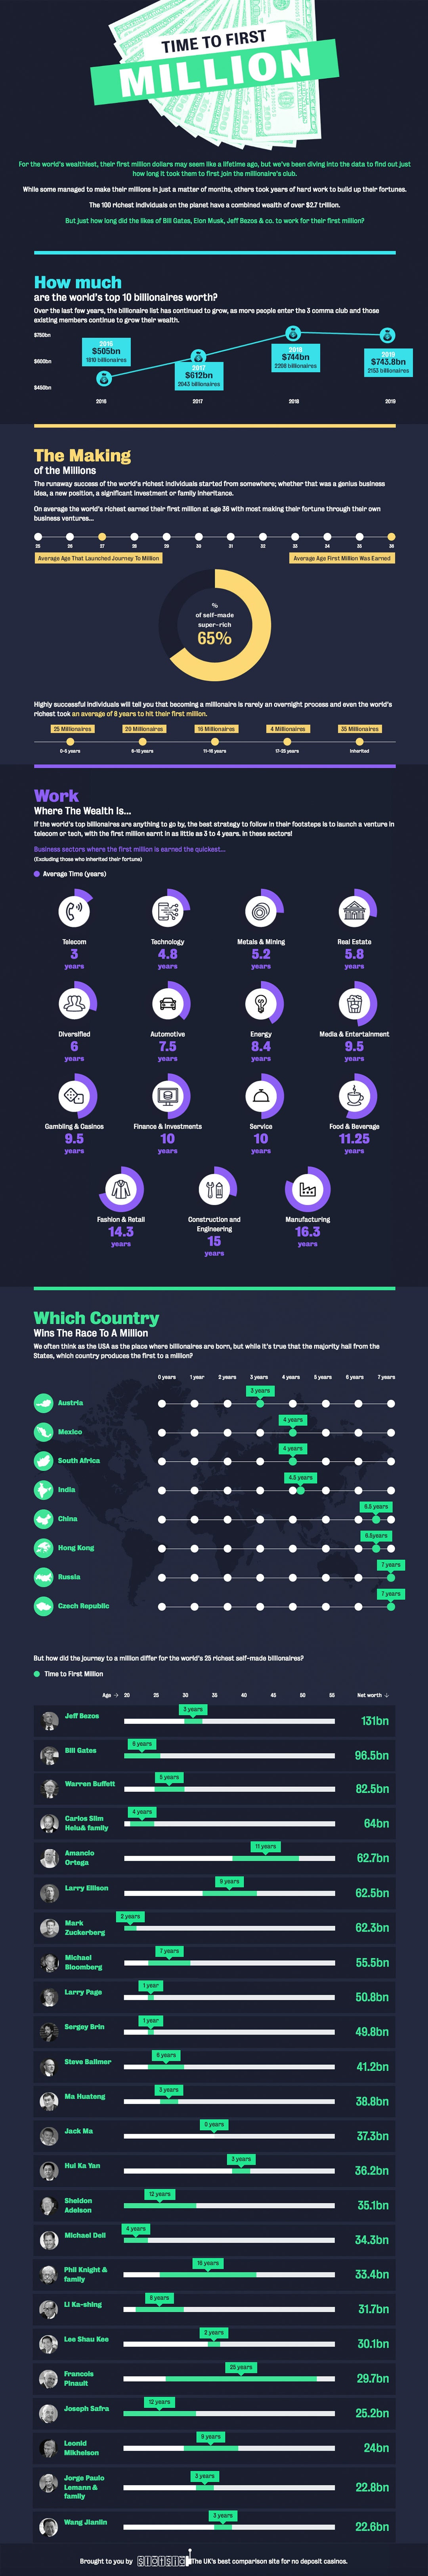
On average, it took about eight years to get to the $1 million mark, with the most common age for hitting the milestone at age 36, and business ventures being the top source of this wealth.
Milestone Time, by Years
Of the top 100 billionaires on he planet, 65 of them are self-made – and here’s how long it took each of them to earn their first $1 million:
| Time to hit $1 Million | Self-made billionaires | % of total |
|---|---|---|
| 0-5 years | 25 | 38% |
| 6-10 years | 20 | 31% |
| 11-16 years | 16 | 25% |
| 17-25 years | 4 | 6% |
Impressively, about 25 self-made billionaires, including people like Mark Zuckerberg, Jack Ma, and Wang Jianlin, were able to make this initial fortune in under five years.
Meanwhile, other founders like Phil Knight of Nike, took 16 years to hit the mark.
Milestone Time, by Industry
While the set of data is limited, here’s how long it took to hit the first million based on industry:
| Time to hit $1 Million | Industry |
|---|---|
| 3.0 years | Telecom |
| 4.8 years | Tech |
| 5.2 years | Metals & Mining |
| 5.8 years | Real Estate |
| 6.0 years | Diversified |
| 7.5 years | Automotive |
| 8.4 years | Energy |
| 9.5 years | Media & Entertainment |
| 9.5 years | Gambling & Casinos |
| 10.0 years | Finance & Investments |
| 10.0 years | Service |
| 11.25 years | Food & Beverage |
| 14.3 years | Fashion & Retail |
| 15.0 years | Construction & Engineering |
| 16.3 years | Manufacturing |
Billionaires in the telecom and tech sectors were the fastest to $1 million, while those in fashion, construction, and manufacturing businesses took much longer to get to the promised land.
Of course, reaching the first financial milestone is only one step in a much longer journey.
For further reading, see how long it took for the world’s wealthiest to make the jump from millionaire to billionaire.


Money
Charted: Which City Has the Most Billionaires in 2024?
Just two countries account for half of the top 20 cities with the most billionaires. And the majority of the other half are found in Asia.


Charted: Which Country Has the Most Billionaires in 2024?
This was originally posted on our Voronoi app. Download the app for free on iOS or Android and discover incredible data-driven charts from a variety of trusted sources.
Some cities seem to attract the rich. Take New York City for example, which has 340,000 high-net-worth residents with investable assets of more than $1 million.
But there’s a vast difference between being a millionaire and a billionaire. So where do the richest of them all live?
Using data from the Hurun Global Rich List 2024, we rank the top 20 cities with the highest number of billionaires in 2024.
A caveat to these rich lists: sources often vary on figures and exact rankings. For example, in last year’s reports, Forbes had New York as the city with the most billionaires, while the Hurun Global Rich List placed Beijing at the top spot.
Ranked: Top 20 Cities with the Most Billionaires in 2024
The Chinese economy’s doldrums over the course of the past year have affected its ultra-wealthy residents in key cities.
Beijing, the city with the most billionaires in 2023, has not only ceded its spot to New York, but has dropped to #4, overtaken by London and Mumbai.
| Rank | City | Billionaires | Rank Change YoY |
|---|---|---|---|
| 1 | 🇺🇸 New York | 119 | +1 |
| 2 | 🇬🇧 London | 97 | +3 |
| 3 | 🇮🇳 Mumbai | 92 | +4 |
| 4 | 🇨🇳 Beijing | 91 | -3 |
| 5 | 🇨🇳 Shanghai | 87 | -2 |
| 6 | 🇨🇳 Shenzhen | 84 | -2 |
| 7 | 🇭🇰 Hong Kong | 65 | -1 |
| 8 | 🇷🇺 Moscow | 59 | No Change |
| 9 | 🇮🇳 New Delhi | 57 | +6 |
| 10 | 🇺🇸 San Francisco | 52 | No Change |
| 11 | 🇹🇭 Bangkok | 49 | +2 |
| 12 | 🇹🇼 Taipei | 45 | +2 |
| 13 | 🇫🇷 Paris | 44 | -2 |
| 14 | 🇨🇳 Hangzhou | 43 | -5 |
| 15 | 🇸🇬 Singapore | 42 | New to Top 20 |
| 16 | 🇨🇳 Guangzhou | 39 | -4 |
| 17T | 🇮🇩 Jakarta | 37 | +1 |
| 17T | 🇧🇷 Sao Paulo | 37 | No Change |
| 19T | 🇺🇸 Los Angeles | 31 | No Change |
| 19T | 🇰🇷 Seoul | 31 | -3 |
In fact all Chinese cities on the top 20 list have lost billionaires between 2023–24. Consequently, they’ve all lost ranking spots as well, with Hangzhou seeing the biggest slide (-5) in the top 20.
Where China lost, all other Asian cities—except Seoul—in the top 20 have gained ranks. Indian cities lead the way, with New Delhi (+6) and Mumbai (+3) having climbed the most.
At a country level, China and the U.S combine to make up half of the cities in the top 20. They are also home to about half of the world’s 3,200 billionaire population.
In other news of note: Hurun officially counts Taylor Swift as a billionaire, estimating her net worth at $1.2 billion.

-

 Debt1 week ago
How Debt-to-GDP Ratios Have Changed Since 2000
-

 Markets2 weeks ago
Ranked: The World’s Top Flight Routes, by Revenue
-

 Countries2 weeks ago
Population Projections: The World’s 6 Largest Countries in 2075
-

 Markets2 weeks ago
The Top 10 States by Real GDP Growth in 2023
-

 Demographics2 weeks ago
The Smallest Gender Wage Gaps in OECD Countries
-

 United States2 weeks ago
Where U.S. Inflation Hit the Hardest in March 2024
-

 Green2 weeks ago
Top Countries By Forest Growth Since 2001
-

 United States2 weeks ago
Ranked: The Largest U.S. Corporations by Number of Employees