Money
The Growing Auto Loan Problem Facing Young Americans
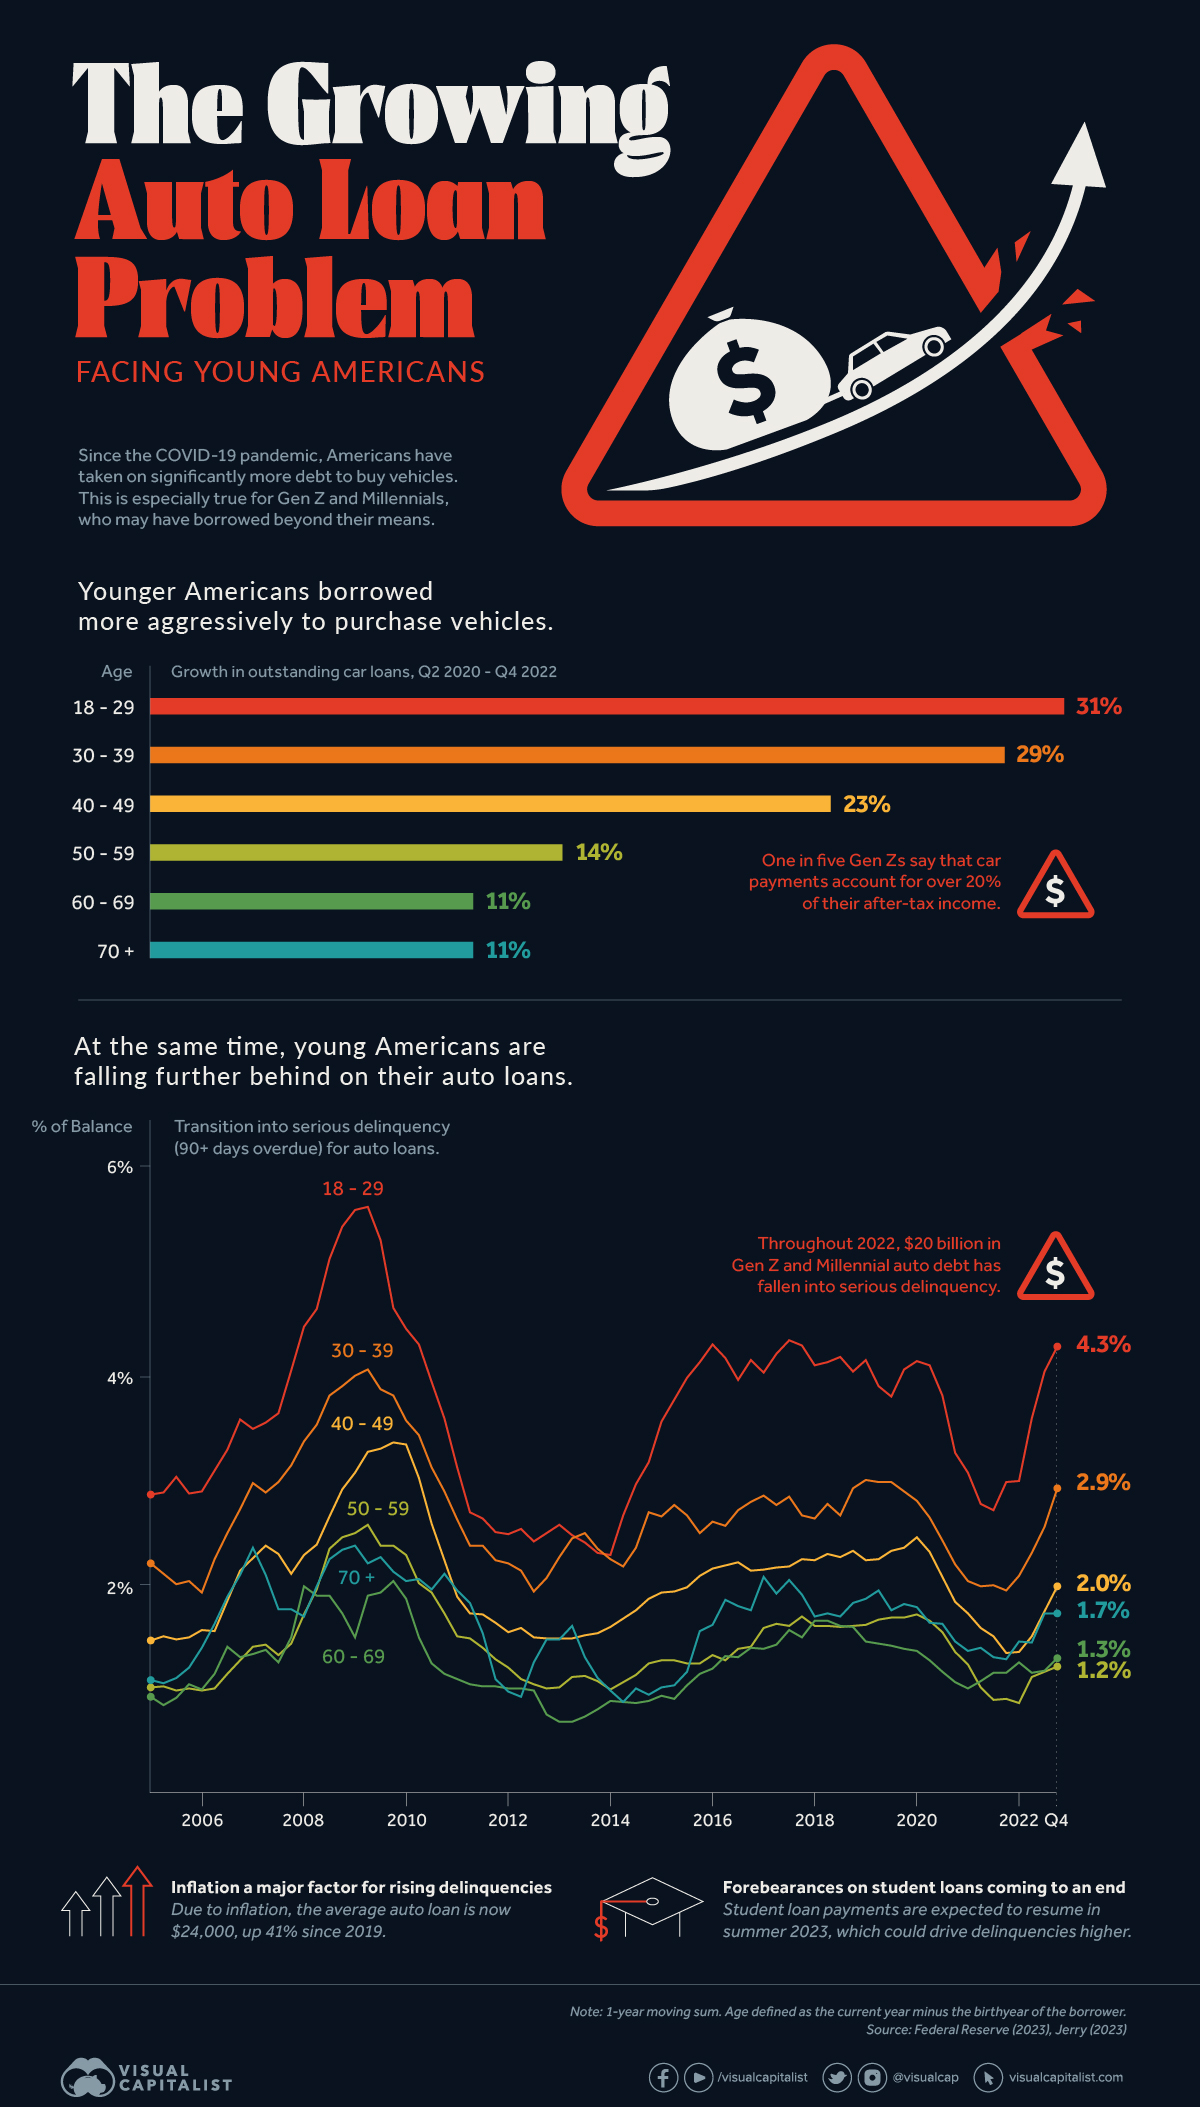
Since the COVID-19 pandemic, Americans have taken on significantly more debt to buy vehicles. This is especially true for Gen Z and Millennials, who the Federal Reserve believes may have borrowed beyond their means.
In this infographic, we’ve visualized data from the Fed’s most recent consumer debt update.
Aggressive Borrowing
The first chart in this graphic shows the growth in outstanding car loans between Q2 2020 (start of the pandemic) to Q4 2022 (latest available).
Age | Growth in outstanding car loans |
---|---|
18-29 | 31% |
30-39 | 29% |
40-49 | 23% |
50-59 | 14% |
60-69 | 11% |
70+ | 11% |
We can see that Americans under the age of 40 have grown their vehicle-related debt the most. It’s natural for Gen Z (ages 11-26) to have higher growth figures because many of them are buying their first car, but 31% is quite high relatively speaking.
Part of this can be attributed to today’s inflationary environment, which has pushed used car prices to new highs. Supply chain issues have also resulted in over 30% of new cars being sold above MSRP.
Because of these rising prices, the Fed reports that the average auto loan is now $24,000, up 41% from 2019’s value of $17,000.
Spiking Delinquencies
Interest rates on auto loans are typically fixed, meaning many young Americans were able to take advantage of the low rates seen during the pandemic.
Despite this, one in five Gen Zs say that their car payments account for over 20% of their after-tax income.
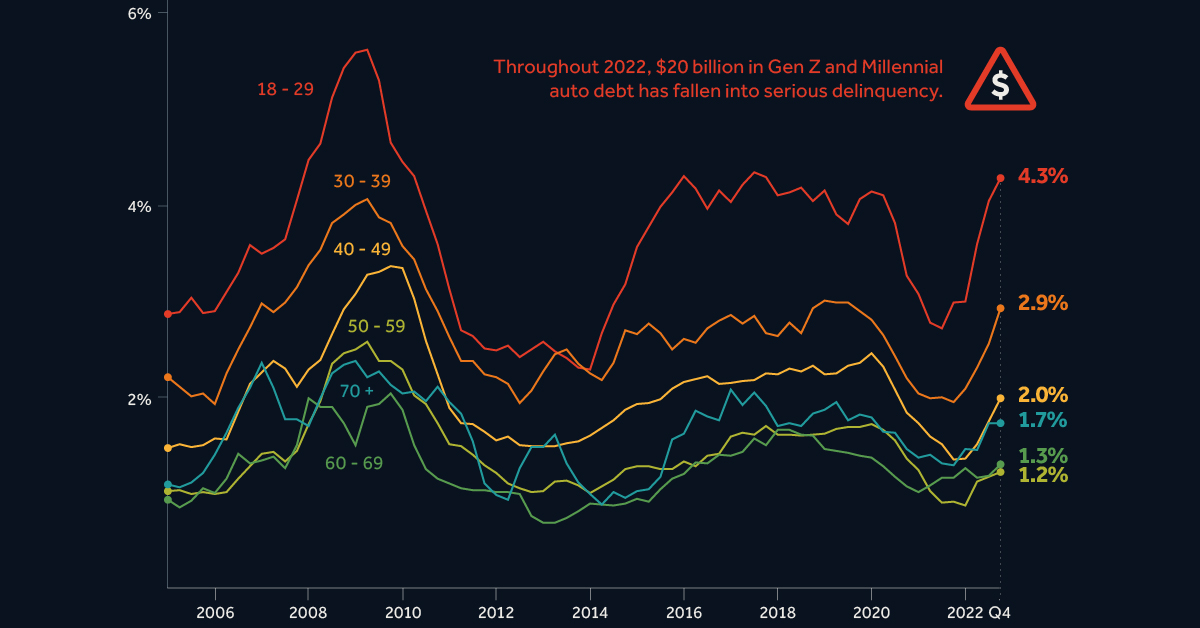
Shown in the second chart of this infographic, the amount of auto debt transitioning into serious delinquency is much higher for Gen Z and Millennials. Throughout 2022, these generations saw $20 billion in auto debt fall 90+ days behind.
The outlook for these struggling borrowers is bleak. First there’s inflation, which has pushed up the prices of most consumer goods. This eats into their ability to make car payments.
Second is rising interest rates, which make credit card debt—another pain point for young borrowers—even more costly. Finally, there’s student loans, which are expected to resume in summer 2023. Payments on student debt have been suspended since the beginning of the COVID-19 pandemic.
Debt
Visualizing $97 Trillion of Global Debt in 2023
Global debt has soared since the pandemic. Which countries have the biggest stockpile of debt outstanding in 2023?

Visualizing $97 Trillion of Government Debt in 2023
Global government debt is projected to hit $97.1 trillion this year, a 40% increase since 2019.
During the COVID-19 pandemic, governments introduced sweeping financial measures to support the job market and prevent a wave of bankruptcies. However, this has exposed vulnerabilities as higher interest rates are amplifying borrowing costs.
This graphic shows global debt by country in 2023, based on projections from the International Monetary Fund (IMF).
Debt by Country in 2023
Below, we rank countries by their general government gross debt, or the financial liabilities owed by each country:
Country | Gross Debt (B) | % of World Total | Debt to GDP |
---|---|---|---|
🇺🇸 U.S. | $33,228.9 | 34.2% | 123.3% |
🇨🇳 China | $14,691.7 | 15.1% | 83.0% |
🇯🇵 Japan | $10,797.2 | 11.1% | 255.2% |
🇬🇧 UK | $3,468.7 | 3.6% | 104.1% |
🇫🇷 France | $3,353.9 | 3.5% | 110.0% |
🇮🇹 Italy | $3,141.4 | 3.2% | 143.7% |
🇮🇳 India | $3,056.7 | 3.1% | 81.9% |
🇩🇪 Germany | $2,919.3 | 3.0% | 65.9% |
🇨🇦 Canada | $2,253.3 | 2.3% | 106.4% |
🇧🇷 Brazil | $1,873.7 | 1.9% | 88.1% |
🇪🇸 Spain | $1,697.5 | 1.7% | 107.3% |
🇲🇽 Mexico | $954.6 | 1.0% | 52.7% |
🇰🇷 South Korea | $928.1 | 1.0% | 54.3% |
🇦🇺 Australia | $875.9 | 0.9% | 51.9% |
🇸🇬 Singapore | $835.0 | 0.9% | 167.9% |
🇧🇪 Belgium | $665.2 | 0.7% | 106.0% |
🇦🇷 Argentina | $556.5 | 0.6% | 89.5% |
🇮🇩 Indonesia | $552.8 | 0.6% | 39.0% |
🇳🇱 Netherlands | $540.9 | 0.6% | 49.5% |
🇵🇱 Poland | $419.4 | 0.4% | 49.8% |
🇬🇷 Greece | $407.2 | 0.4% | 168.0% |
🇹🇷 Türkiye | $397.2 | 0.4% | 34.4% |
🇷🇺 Russia | $394.8 | 0.4% | 21.2% |
🇦🇹 Austria | $393.6 | 0.4% | 74.8% |
🇪🇬 Egypt | $369.3 | 0.4% | 92.7% |
🇨🇭 Switzerland | $357.7 | 0.4% | 39.5% |
🇹🇭 Thailand | $314.5 | 0.3% | 61.4% |
🇮🇱 Israel | $303.6 | 0.3% | 58.2% |
🇵🇹 Portugal | $299.4 | 0.3% | 108.3% |
🇲🇾 Malaysia | $288.3 | 0.3% | 66.9% |
🇿🇦 South Africa | $280.7 | 0.3% | 73.7% |
🇵🇰 Pakistan | $260.9 | 0.3% | 76.6% |
🇸🇦 Saudi Arabia | $257.7 | 0.3% | 24.1% |
🇮🇪 Ireland | $251.7 | 0.3% | 42.7% |
🇵🇭 Philippines | $250.9 | 0.3% | 57.6% |
🇫🇮 Finland | $225.0 | 0.2% | 73.6% |
🇳🇴 Norway | $204.5 | 0.2% | 37.4% |
🇨🇴 Colombia | $200.1 | 0.2% | 55.0% |
🇹🇼 Taiwan | $200.0 | 0.2% | 26.6% |
🇸🇪 Sweden | $192.9 | 0.2% | 32.3% |
🇷🇴 Romania | $178.7 | 0.2% | 51.0% |
🇧🇩 Bangladesh | $175.9 | 0.2% | 39.4% |
🇺🇦 Ukraine | $152.8 | 0.2% | 88.1% |
🇨🇿 Czech Republic | $152.2 | 0.2% | 45.4% |
🇳🇬 Nigeria | $151.3 | 0.2% | 38.8% |
🇦🇪 UAE | $149.7 | 0.2% | 29.4% |
🇻🇳 Vietnam | $147.3 | 0.2% | 34.0% |
🇭🇺 Hungary | $140.0 | 0.1% | 68.7% |
🇨🇱 Chile | $132.2 | 0.1% | 38.4% |
🇩🇰 Denmark | $126.7 | 0.1% | 30.1% |
🇮🇶 Iraq | $125.5 | 0.1% | 49.2% |
🇩🇿 Algeria | $123.5 | 0.1% | 55.1% |
🇳🇿 New Zealand | $115.0 | 0.1% | 46.1% |
🇮🇷 Iran | $112.1 | 0.1% | 30.6% |
🇲🇦 Morocco | $102.7 | 0.1% | 69.7% |
🇶🇦 Qatar | $97.5 | 0.1% | 41.4% |
🇵🇪 Peru | $89.7 | 0.1% | 33.9% |
🇦🇴 Angola | $79.6 | 0.1% | 84.9% |
🇰🇪 Kenya | $79.1 | 0.1% | 70.2% |
🇸🇰 Slovakia | $75.4 | 0.1% | 56.7% |
🇩🇴 Dominican Republic | $72.1 | 0.1% | 59.8% |
🇪🇨 Ecuador | $65.9 | 0.1% | 55.5% |
🇸🇩 Sudan | $65.5 | 0.1% | 256.0% |
🇬🇭 Ghana | $65.1 | 0.1% | 84.9% |
🇰🇿 Kazakhstan | $60.7 | 0.1% | 23.4% |
🇪🇹 Ethiopia | $59.0 | 0.1% | 37.9% |
🇧🇭 Bahrain | $54.5 | 0.1% | 121.2% |
🇨🇷 Costa Rica | $53.9 | 0.1% | 63.0% |
🇭🇷 Croatia | $51.2 | 0.1% | 63.8% |
🇺🇾 Uruguay | $47.0 | 0.0% | 61.6% |
🇯🇴 Jordan | $46.9 | 0.0% | 93.8% |
🇸🇮 Slovenia | $46.8 | 0.0% | 68.5% |
🇨🇮 Côte d'Ivoire | $45.1 | 0.0% | 56.8% |
🇵🇦 Panama | $43.5 | 0.0% | 52.8% |
🇲🇲 Myanmar | $43.0 | 0.0% | 57.5% |
🇴🇲 Oman | $41.4 | 0.0% | 38.2% |
🇹🇳 Tunisia | $39.9 | 0.0% | 77.8% |
🇷🇸 Serbia | $38.5 | 0.0% | 51.3% |
🇧🇴 Bolivia | $37.8 | 0.0% | 80.8% |
🇹🇿 Tanzania | $35.8 | 0.0% | 42.6% |
🇺🇿 Uzbekistan | $31.7 | 0.0% | 35.1% |
🇿🇼 Zimbabwe | $30.9 | 0.0% | 95.4% |
🇧🇾 Belarus | $30.4 | 0.0% | 44.1% |
🇬🇹 Guatemala | $29.1 | 0.0% | 28.3% |
🇱🇹 Lithuania | $28.7 | 0.0% | 36.1% |
🇸🇻 El Salvador | $25.8 | 0.0% | 73.0% |
🇺🇬 Uganda | $25.3 | 0.0% | 48.3% |
🇸🇳 Senegal | $25.2 | 0.0% | 81.0% |
🇨🇾 Cyprus | $25.2 | 0.0% | 78.6% |
🇱🇺 Luxembourg | $24.6 | 0.0% | 27.6% |
🇭🇰 Hong Kong SAR | $23.5 | 0.0% | 6.1% |
🇧🇬 Bulgaria | $21.7 | 0.0% | 21.0% |
🇨🇲 Cameroon | $20.6 | 0.0% | 41.9% |
🇲🇿 Mozambique | $19.7 | 0.0% | 89.7% |
🇵🇷 Puerto Rico | $19.6 | 0.0% | 16.7% |
🇳🇵 Nepal | $19.3 | 0.0% | 46.7% |
🇱🇻 Latvia | $18.9 | 0.0% | 40.6% |
🇮🇸 Iceland | $18.7 | 0.0% | 61.2% |
🇵🇾 Paraguay | $18.1 | 0.0% | 40.9% |
🇱🇦 Lao P.D.R. | $17.3 | 0.0% | 121.7% |
🇭🇳 Honduras | $15.7 | 0.0% | 46.3% |
🇵🇬 Papua New Guinea | $15.7 | 0.0% | 49.5% |
🇹🇹 Trinidad and Tobago | $14.6 | 0.0% | 52.5% |
🇦🇱 Albania | $14.5 | 0.0% | 62.9% |
🇨🇬 Republic of Congo | $14.1 | 0.0% | 97.8% |
🇦🇿 Azerbaijan | $14.1 | 0.0% | 18.2% |
🇾🇪 Yemen | $14.0 | 0.0% | 66.4% |
🇯🇲 Jamaica | $13.6 | 0.0% | 72.3% |
🇲🇳 Mongolia | $13.1 | 0.0% | 69.9% |
🇧🇫 Burkina Faso | $12.7 | 0.0% | 61.2% |
🇬🇦 Gabon | $12.5 | 0.0% | 64.9% |
🇬🇪 Georgia | $11.9 | 0.0% | 39.6% |
🇲🇺 Mauritius | $11.8 | 0.0% | 79.7% |
🇦🇲 Armenia | $11.8 | 0.0% | 47.9% |
🇧🇸 Bahamas | $11.7 | 0.0% | 84.2% |
🇲🇱 Mali | $11.0 | 0.0% | 51.8% |
🇲🇹 Malta | $11.0 | 0.0% | 54.1% |
🇰🇭 Cambodia | $10.9 | 0.0% | 35.3% |
🇧🇯 Benin | $10.6 | 0.0% | 53.0% |
🇲🇼 Malawi | $10.4 | 0.0% | 78.6% |
🇪🇪 Estonia | $9.0 | 0.0% | 21.6% |
🇨🇩 Democratic Republic of Congo | $9.0 | 0.0% | 13.3% |
🇷🇼 Rwanda | $8.8 | 0.0% | 63.3% |
🇳🇦 Namibia | $8.5 | 0.0% | 67.6% |
🇲🇬 Madagascar | $8.5 | 0.0% | 54.0% |
🇳🇪 Niger | $8.3 | 0.0% | 48.7% |
🇲🇰 North Macedonia | $8.2 | 0.0% | 51.6% |
🇧🇦 Bosnia and Herzegovina | $7.7 | 0.0% | 28.6% |
🇲🇻 Maldives | $7.7 | 0.0% | 110.3% |
🇬🇳 Guinea | $7.3 | 0.0% | 31.6% |
🇳🇮 Nicaragua | $7.2 | 0.0% | 41.5% |
🇧🇧 Barbados | $7.2 | 0.0% | 115.0% |
🇹🇬 Togo | $6.1 | 0.0% | 67.2% |
🇰🇬 Kyrgyz Republic | $6.0 | 0.0% | 47.0% |
🇲🇩 Moldova | $5.6 | 0.0% | 35.1% |
🇹🇩 Chad | $5.4 | 0.0% | 43.2% |
🇰🇼 Kuwait | $5.4 | 0.0% | 3.4% |
🇲🇷 Mauritania | $5.1 | 0.0% | 49.5% |
🇭🇹 Haiti | $5.1 | 0.0% | 19.6% |
🇬🇾 Guyana | $4.9 | 0.0% | 29.9% |
🇲🇪 Montenegro | $4.6 | 0.0% | 65.8% |
🇫🇯 Fiji | $4.6 | 0.0% | 83.6% |
🇹🇲 Turkmenistan | $4.2 | 0.0% | 5.1% |
🇹🇯 Tajikistan | $4.0 | 0.0% | 33.5% |
🇧🇼 Botswana | $3.9 | 0.0% | 18.7% |
🇬🇶 Equatorial Guinea | $3.8 | 0.0% | 38.3% |
🇸🇷 Suriname | $3.8 | 0.0% | 107.0% |
🇸🇸 South Sudan | $3.8 | 0.0% | 60.4% |
🇧🇹 Bhutan | $3.3 | 0.0% | 123.4% |
🇦🇼 Aruba | $3.2 | 0.0% | 82.9% |
🇸🇱 Sierra Leone | $3.1 | 0.0% | 88.9% |
🇨🇻 Cabo Verde | $2.9 | 0.0% | 113.1% |
🇧🇮 Burundi | $2.3 | 0.0% | 72.7% |
🇱🇷 Liberia | $2.3 | 0.0% | 52.3% |
🇽🇰 Kosovo | $2.2 | 0.0% | 21.3% |
🇸🇿 Eswatini | $2.0 | 0.0% | 42.4% |
🇧🇿 Belize | $1.9 | 0.0% | 59.3% |
🇱🇨 Saint Lucia | $1.8 | 0.0% | 74.2% |
🇬🇲 Gambia | $1.7 | 0.0% | 72.3% |
🇩🇯 Djibouti | $1.6 | 0.0% | 41.8% |
🇦🇬 Antigua and Barbuda | $1.6 | 0.0% | 80.5% |
🇸🇲 San Marino | $1.5 | 0.0% | 74.0% |
🇬🇼 Guinea-Bissau | $1.5 | 0.0% | 73.9% |
🇱🇸 Lesotho | $1.5 | 0.0% | 61.3% |
🇦🇩 Andorra | $1.4 | 0.0% | 37.7% |
🇨🇫 Central African Republic | $1.4 | 0.0% | 50.1% |
🇸🇨 Seychelles | $1.3 | 0.0% | 60.8% |
🇻🇨 Saint Vincent and the Grenadines | $0.9 | 0.0% | 86.2% |
🇬🇩 Grenada | $0.8 | 0.0% | 60.2% |
🇩🇲 Dominica | $0.7 | 0.0% | 93.9% |
🇰🇳 Saint Kitts and Nevis | $0.6 | 0.0% | 53.2% |
🇻🇺 Vanuatu | $0.5 | 0.0% | 46.8% |
🇰🇲 Comoros | $0.5 | 0.0% | 33.3% |
🇸🇹 São Tomé and Príncipe | $0.4 | 0.0% | 58.5% |
🇸🇧 Solomon Islands | $0.4 | 0.0% | 22.2% |
🇧🇳 Brunei Darussalam | $0.3 | 0.0% | 2.3% |
🇼🇸 Samoa | $0.3 | 0.0% | 36.2% |
🇹🇱 Timor-Leste | $0.3 | 0.0% | 16.4% |
🇵🇼 Palau | $0.2 | 0.0% | 85.4% |
🇹🇴 Tonga | $0.2 | 0.0% | 41.1% |
🇫🇲 Micronesia | $0.1 | 0.0% | 12.5% |
🇲🇭 Marshall Islands | $0.1 | 0.0% | 18.1% |
🇳🇷 Nauru | <$0.1 | 0.0% | 29.1% |
🇰🇮 Kiribati | <$0.1 | 0.0% | 13.1% |
🇹🇻 Tuvalu | <$0.1 | 0.0% | 8.0% |
🇲🇴 Macao SAR | <$0.1 | 0.0% | 0.0% |
🌐 World | $97,129.8 | 100% | 93.0% |
With $33.2 trillion in government debt, the U.S. makes up over a third of the world total.
Given the increasing debt load, the cost of servicing this debt now accounts for 20% of government spending. It is projected to reach $1 trillion by 2028, surpassing the total spent on defense.
The world’s third-biggest economy, Japan, has one of the highest debt to GDP ratios, at 255%. Over the last two decades, its national debt has far exceeded 100% of its GDP, driven by an aging population and social security expenses.
In 2023, Egypt faces steep borrowing costs, with 40% of revenues going towards debt repayments. It has the highest debt on the continent.
Like Egypt, several emerging economies are facing strain. Lebanon has been in default since 2020, and Ghana defaulted on the majority of its external debt—debt owed to foreign lenders—in 2022 amid a deepening economic crisis.
Global Debt: A Regional Perspective
How does debt compare on a regional level in 2023?
Region | Gross Debt (B) | % of World Total | Debt to GDP |
---|---|---|---|
North America | $36,451.8 | 37.5% | 117.6% |
Asia and Pacific | $34,257.4 | 35.3% | 92.5% |
Europe | $20,123.4 | 20.7% | 79.1% |
South America | $3,164.9 | 3.3% | 77.2% |
Africa | $1,863.6 | 1.9% | 65.2% |
Other/Rest of World | $1,269.1 | 1.3% | 31.4% |
We can see that North America has both the highest debt and debt to GDP compared to other regions. Just as U.S. debt has ballooned, so has Canada’s—ranking as the 10th-highest globally in government debt outstanding.
Across Asia and the Pacific, debt levels hover close to North America.
At 3.3% of the global total, South America has $3.2 trillion in debt. As inflation has trended downwards, a handful of governments have already begun cutting interest rates. Overall, public debt levels are projected to stay elevated across the region.
Debt levels have also risen rapidly in Africa, with an average 40% of public debt held in foreign currencies—leaving it exposed to exchange rate fluctuations. Another challenge is that interest rates are also higher across the region compared to advanced economies, increasing debt-servicing costs.
By 2028, the IMF projects that global public debt will exceed 100% of GDP, hitting levels only seen during the pandemic.
-
Markets1 week ago
Recession Risk: Which Sectors are Least Vulnerable?
-
Revenue2 weeks ago
Ranked: The Biggest Retailers in the U.S. by Revenue
-
Globalization2 weeks ago
The Top 50 Largest Importers in the World
-
Maps2 weeks ago
Mapped: Which Countries Recognize Israel or Palestine, or Both?
-
Education2 weeks ago
Ranked: America’s Best Universities
-
Countries1 week ago
Ranked: Share of Global Arms Imports in 2022
-
Countries1 week ago
Ranked: Share of Global Arms Exports in 2022
-
Globalization1 week ago
Charted: The Industries Where Asian Companies are the Strongest