Markets
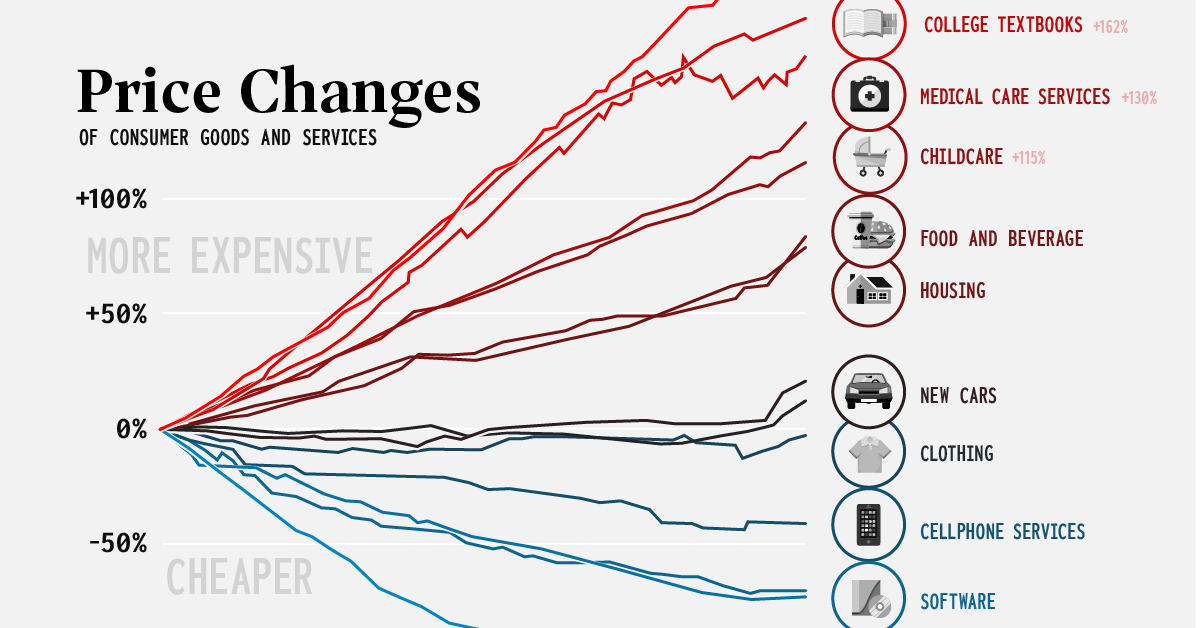
Consumer Price Inflation, by Type of Good or Service (2000-2022)
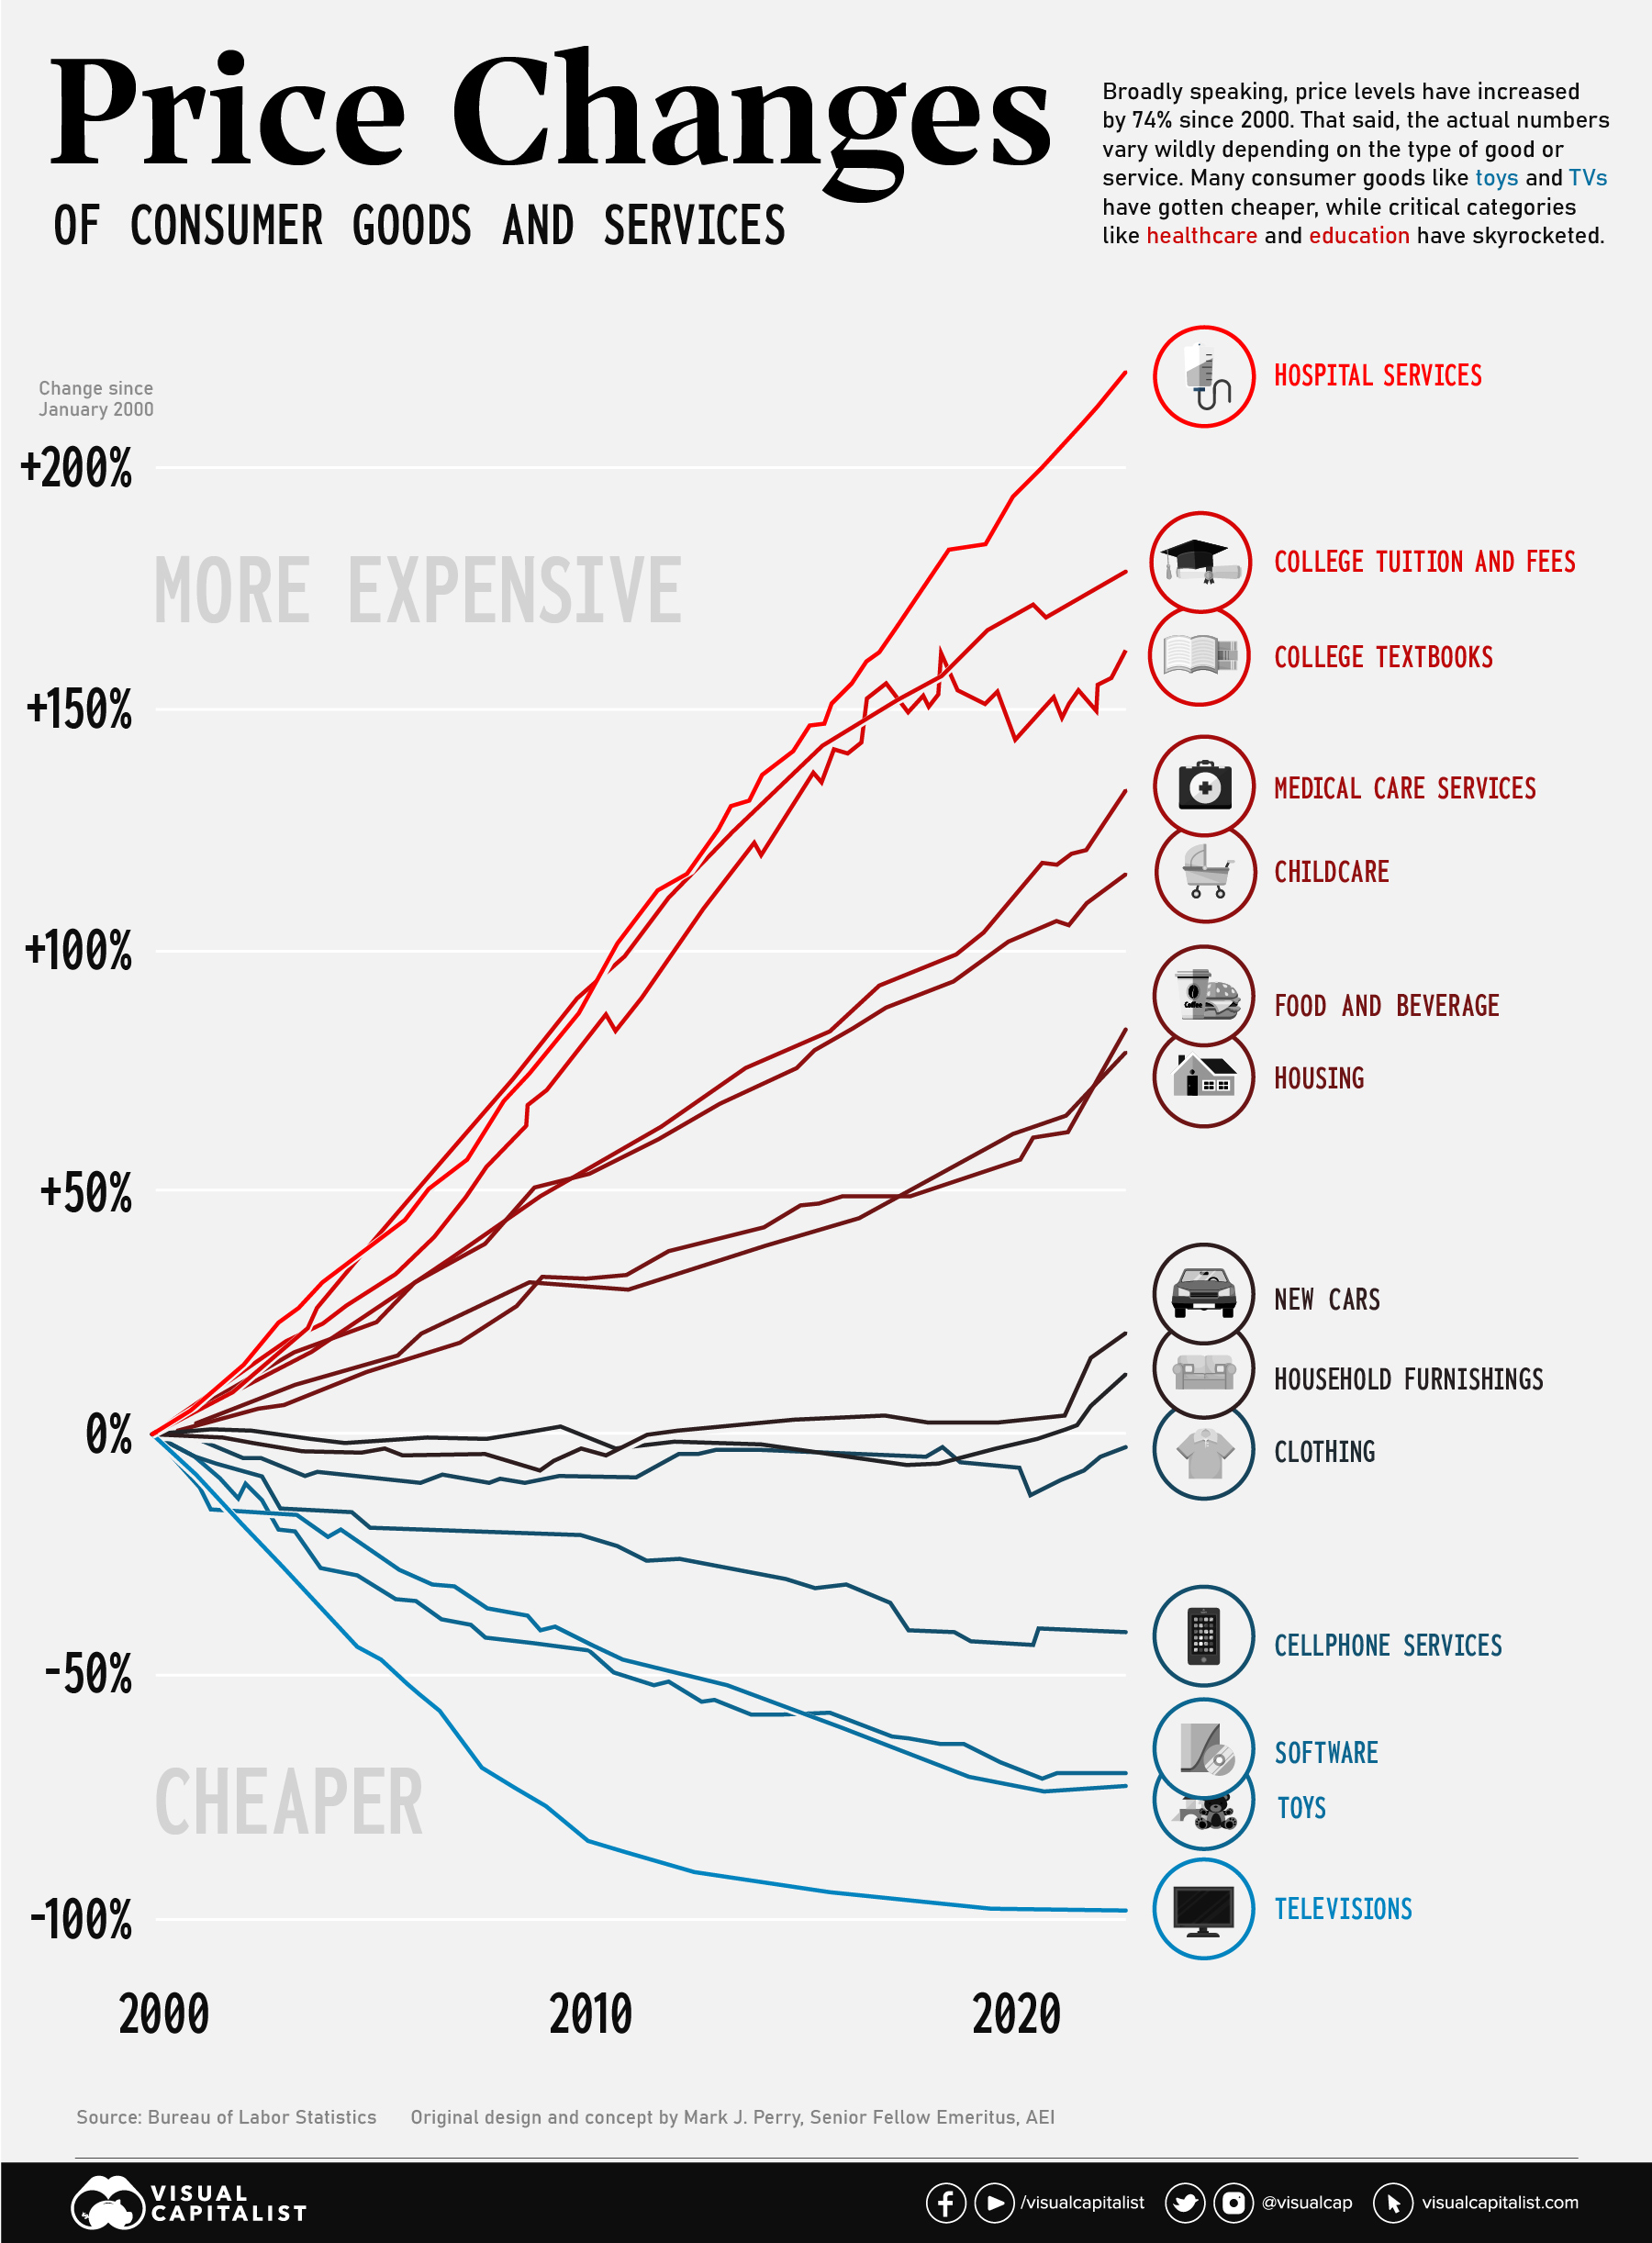
Consumer Price Inflation, by Type of Good or Service (2000-2022)
The Consumer Price Index (CPI) provides a steady indication of how inflation is affecting the economy. This big picture number is useful for policymakers and professionals in the financial sector, but most people experience inflation at the cash register or checkout screen.
Since the start of the 21st century, U.S. consumers have seen a divergence of price movements across various categories. Nowhere is this better illustrated than on this chart concept thought up by AEI’s Mark J. Perry. It’s sometimes referred to as the “chart of the century” because it provides such a clear and impactful jump-off point to discuss a number of economic forces.
The punchline is that many consumer goods—particularly those that were easily outsourced—saw price drops, while key “non-tradable” categories saw massive increases. We’ll look at both situations in more detail below.
Race to the Top: Inflation in Healthcare and Education
Since the beginning of this century, two types of essential categories have been marching steadily upward in price: healthcare and education.
America has a well documented “medical inflation” issue. There are a number of reasons why costs in the healthcare sector keep rising, including rising labor costs, an aging population, better technology, and medical tourism. The pricing of pharmaceutical products and hospital services are also a major contributor to increases. As Barry Ritholtz has diplomatically stated, “market forces don’t work very well in this industry”.
Rising medical costs have serious consequences for the U.S. population. Recent data indicates that half of Americans now carry medical debt, with the majority owing $1,000 or more.
Also near the top of the chart are education-related categories. In the ’60s and ’70s, tuition roughly tracked with inflation, but that began to change in the mid-1980s. Since then, tuition costs have marched ever upward. Since 2000, tuition prices have increased by 178% and college textbooks have jumped 162%.
As usual, low income students are disproportionally impacted by rising tuition. Pell Grants now cover a much smaller portion of tuition than they used to, and the majority of states have cut funding to higher education in recent years.
Globalization: A Tale of Televisions and Toys
Even though essentials like education and heathcare have rocketed up, it’s not all bad news. Consumers have seen the price of some goods and services drop dramatically.
Flat screen televisions used to be a big ticket item. At the turn of the century, a flat screen TV would cost around 17% of the median income of the time ($42,148). In the early aughts though, prices began to fall quickly. Today, a new TV will cost less than 1% of the U.S. median income ($54,132).
Similarly, cellular services and software have gotten cheaper over the past two decades as well. Toys are another prime example. Not only are most toys manufactured overseas, the value proposition has changed as children have new digital options to entertain themselves with.
Over a long-term perspective, items like clothing and household furnishings have remained relatively flat in price, even after the most recent bout of inflation.


Markets
The European Stock Market: Attractive Valuations Offer Opportunities
On average, the European stock market has valuations that are nearly 50% lower than U.S. valuations. But how can you access the market?


European Stock Market: Attractive Valuations Offer Opportunities
Europe is known for some established brands, from L’Oréal to Louis Vuitton. However, the European stock market offers additional opportunities that may be lesser known.
The above infographic, sponsored by STOXX, outlines why investors may want to consider European stocks.
Attractive Valuations
Compared to most North American and Asian markets, European stocks offer lower or comparable valuations.
| Index | Price-to-Earnings Ratio | Price-to-Book Ratio |
|---|---|---|
| EURO STOXX 50 | 14.9 | 2.2 |
| STOXX Europe 600 | 14.4 | 2 |
| U.S. | 25.9 | 4.7 |
| Canada | 16.1 | 1.8 |
| Japan | 15.4 | 1.6 |
| Asia Pacific ex. China | 17.1 | 1.8 |
Data as of February 29, 2024. See graphic for full index names. Ratios based on trailing 12 month financials. The price to earnings ratio excludes companies with negative earnings.
On average, European valuations are nearly 50% lower than U.S. valuations, potentially offering an affordable entry point for investors.
Research also shows that lower price ratios have historically led to higher long-term returns.
Market Movements Not Closely Connected
Over the last decade, the European stock market had low-to-moderate correlation with North American and Asian equities.
The below chart shows correlations from February 2014 to February 2024. A value closer to zero indicates low correlation, while a value of one would indicate that two regions are moving in perfect unison.
| EURO STOXX 50 | STOXX EUROPE 600 | U.S. | Canada | Japan | Asia Pacific ex. China |
|
|---|---|---|---|---|---|---|
| EURO STOXX 50 | 1.00 | 0.97 | 0.55 | 0.67 | 0.24 | 0.43 |
| STOXX EUROPE 600 | 1.00 | 0.56 | 0.71 | 0.28 | 0.48 | |
| U.S. | 1.00 | 0.73 | 0.12 | 0.25 | ||
| Canada | 1.00 | 0.22 | 0.40 | |||
| Japan | 1.00 | 0.88 | ||||
| Asia Pacific ex. China | 1.00 |
Data is based on daily USD returns.
European equities had relatively independent market movements from North American and Asian markets. One contributing factor could be the differing sector weights in each market. For instance, technology makes up a quarter of the U.S. market, but health care and industrials dominate the broader European market.
Ultimately, European equities can enhance portfolio diversification and have the potential to mitigate risk for investors.
Tracking the Market
For investors interested in European equities, STOXX offers a variety of flagship indices:
| Index | Description | Market Cap |
|---|---|---|
| STOXX Europe 600 | Pan-regional, broad market | €10.5T |
| STOXX Developed Europe | Pan-regional, broad-market | €9.9T |
| STOXX Europe 600 ESG-X | Pan-regional, broad market, sustainability focus | €9.7T |
| STOXX Europe 50 | Pan-regional, blue-chip | €5.1T |
| EURO STOXX 50 | Eurozone, blue-chip | €3.5T |
Data is as of February 29, 2024. Market cap is free float, which represents the shares that are readily available for public trading on stock exchanges.
The EURO STOXX 50 tracks the Eurozone’s biggest and most traded companies. It also underlies one of the world’s largest ranges of ETFs and mutual funds. As of November 2023, there were €27.3 billion in ETFs and €23.5B in mutual fund assets under management tracking the index.
“For the past 25 years, the EURO STOXX 50 has served as an accurate, reliable and tradable representation of the Eurozone equity market.”
— Axel Lomholt, General Manager at STOXX
Partnering with STOXX to Track the European Stock Market
Are you interested in European equities? STOXX can be a valuable partner:
- Comprehensive, liquid and investable ecosystem
- European heritage, global reach
- Highly sophisticated customization capabilities
- Open architecture approach to using data
- Close partnerships with clients
- Part of ISS STOXX and Deutsche Börse Group
With a full suite of indices, STOXX can help you benchmark against the European stock market.
Learn how STOXX’s European indices offer liquid and effective market access.

-

 Economy2 days ago
Economic Growth Forecasts for G7 and BRICS Countries in 2024
The IMF has released its economic growth forecasts for 2024. How do the G7 and BRICS countries compare?
-

 Markets1 week ago
U.S. Debt Interest Payments Reach $1 Trillion
U.S. debt interest payments have surged past the $1 trillion dollar mark, amid high interest rates and an ever-expanding debt burden.
-

 United States2 weeks ago
Ranked: The Largest U.S. Corporations by Number of Employees
We visualized the top U.S. companies by employees, revealing the massive scale of retailers like Walmart, Target, and Home Depot.
-

 Markets2 weeks ago
The Top 10 States by Real GDP Growth in 2023
This graphic shows the states with the highest real GDP growth rate in 2023, largely propelled by the oil and gas boom.
-

 Markets2 weeks ago
Ranked: The World’s Top Flight Routes, by Revenue
In this graphic, we show the highest earning flight routes globally as air travel continued to rebound in 2023.
-

 Markets2 weeks ago
Ranked: The Most Valuable Housing Markets in America
The U.S. residential real estate market is worth a staggering $47.5 trillion. Here are the most valuable housing markets in the country.


-

 Misc1 week ago
How Hard Is It to Get Into an Ivy League School?
-

 Technology2 weeks ago
Ranked: Semiconductor Companies by Industry Revenue Share
-
Markets2 weeks ago
Ranked: The World’s Top Flight Routes, by Revenue
-

 Countries2 weeks ago
Population Projections: The World’s 6 Largest Countries in 2075
-
Markets2 weeks ago
The Top 10 States by Real GDP Growth in 2023
-

 Demographics2 weeks ago
The Smallest Gender Wage Gaps in OECD Countries
-

 United States2 weeks ago
Where U.S. Inflation Hit the Hardest in March 2024
-

 Green2 weeks ago
Top Countries By Forest Growth Since 2001