

Older, better-educated adults are winning the savings game, reveals a January survey by the National Opinion Research Center at the University of Chicago.
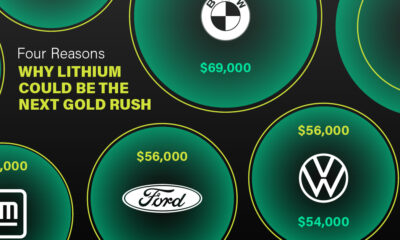

Visual Capitalist has partnered with EnergyX to show why drops in prices and growing demand may make now the right time to invest in lithium.


Tracking Gallup survey data for more than a decade reveals some countries are witnessing big happiness declines, reflecting their shifting socio-economic conditions.


A sneak preview of the exclusive VC+ Special Dispatch—your shortcut to understanding IMF's World Economic Outlook report.


Tracking Gallup survey data for more than a decade reveals insights into the regions seeing happiness gains.


Asia dominates this ranking of the world's largest EV battery manufacturers in 2023.


From complete overhauls to more subtle tweaks, these tech logos have had quite a journey. Featuring: Google, Apple, and more.
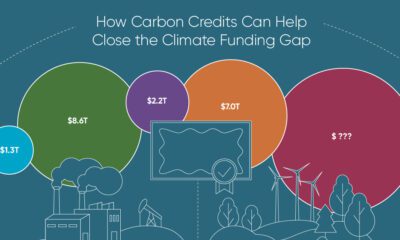

To keep a 1.5℃ world within reach, global emissions need to fall by as much as 45% by 2030, and carbon credits could help close the...


While smaller animals such as weasels typically live 1-2 years, larger counterparts can thrive for decades.


We illustrate how much the highest earning athletes across seven different sports make, and where they get their money from.


