

Older, better-educated adults are winning the savings game, reveals a January survey by the National Opinion Research Center at the University of Chicago.


See how much the debt-to-GDP ratios of advanced economies have grown (or shrank) since the year 2000.
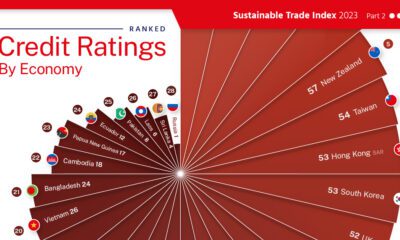

This graphic visualizes 30 country's credit ratings, using data from the 2023 Sustainable Trade Index.
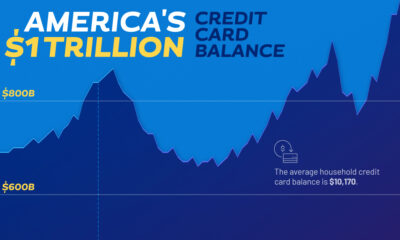

Americans’ collective credit card debt surpassed $1 trillion for the first time in 2023.
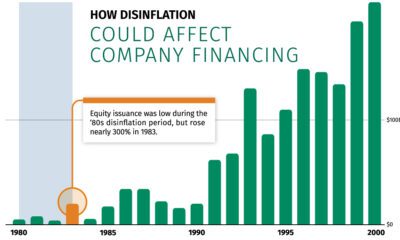

History signals that after a period of slowing inflation—also known as disinflation—debt and equity issuance expands.
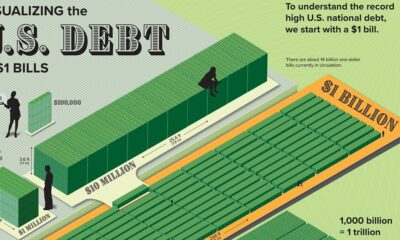

Can you picture what $31.4 trillion looks like? This graphic stacks up $1 bills to visualize U.S. debt in physical form.


Since 2008, the value of unrecorded dollar debt has doubled. Here's why this is increasing risk in global financial markets.


From the wealth held to billionaires to all debt in the global financial system, we look at the vast universe of money and markets in 2022.


In this infographic, we examine new data that ranks the top 25 countries by their default risk.
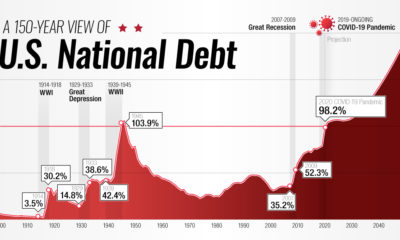

This interactive visual shows how the U.S. national debt has fluctuated since 1900, as well as projections all the way to 2050.


 Creator Program