Money
Visualizing America’s $1 Trillion Credit Card Debt
Visualizing America’s $1 Trillion Credit Card Debt
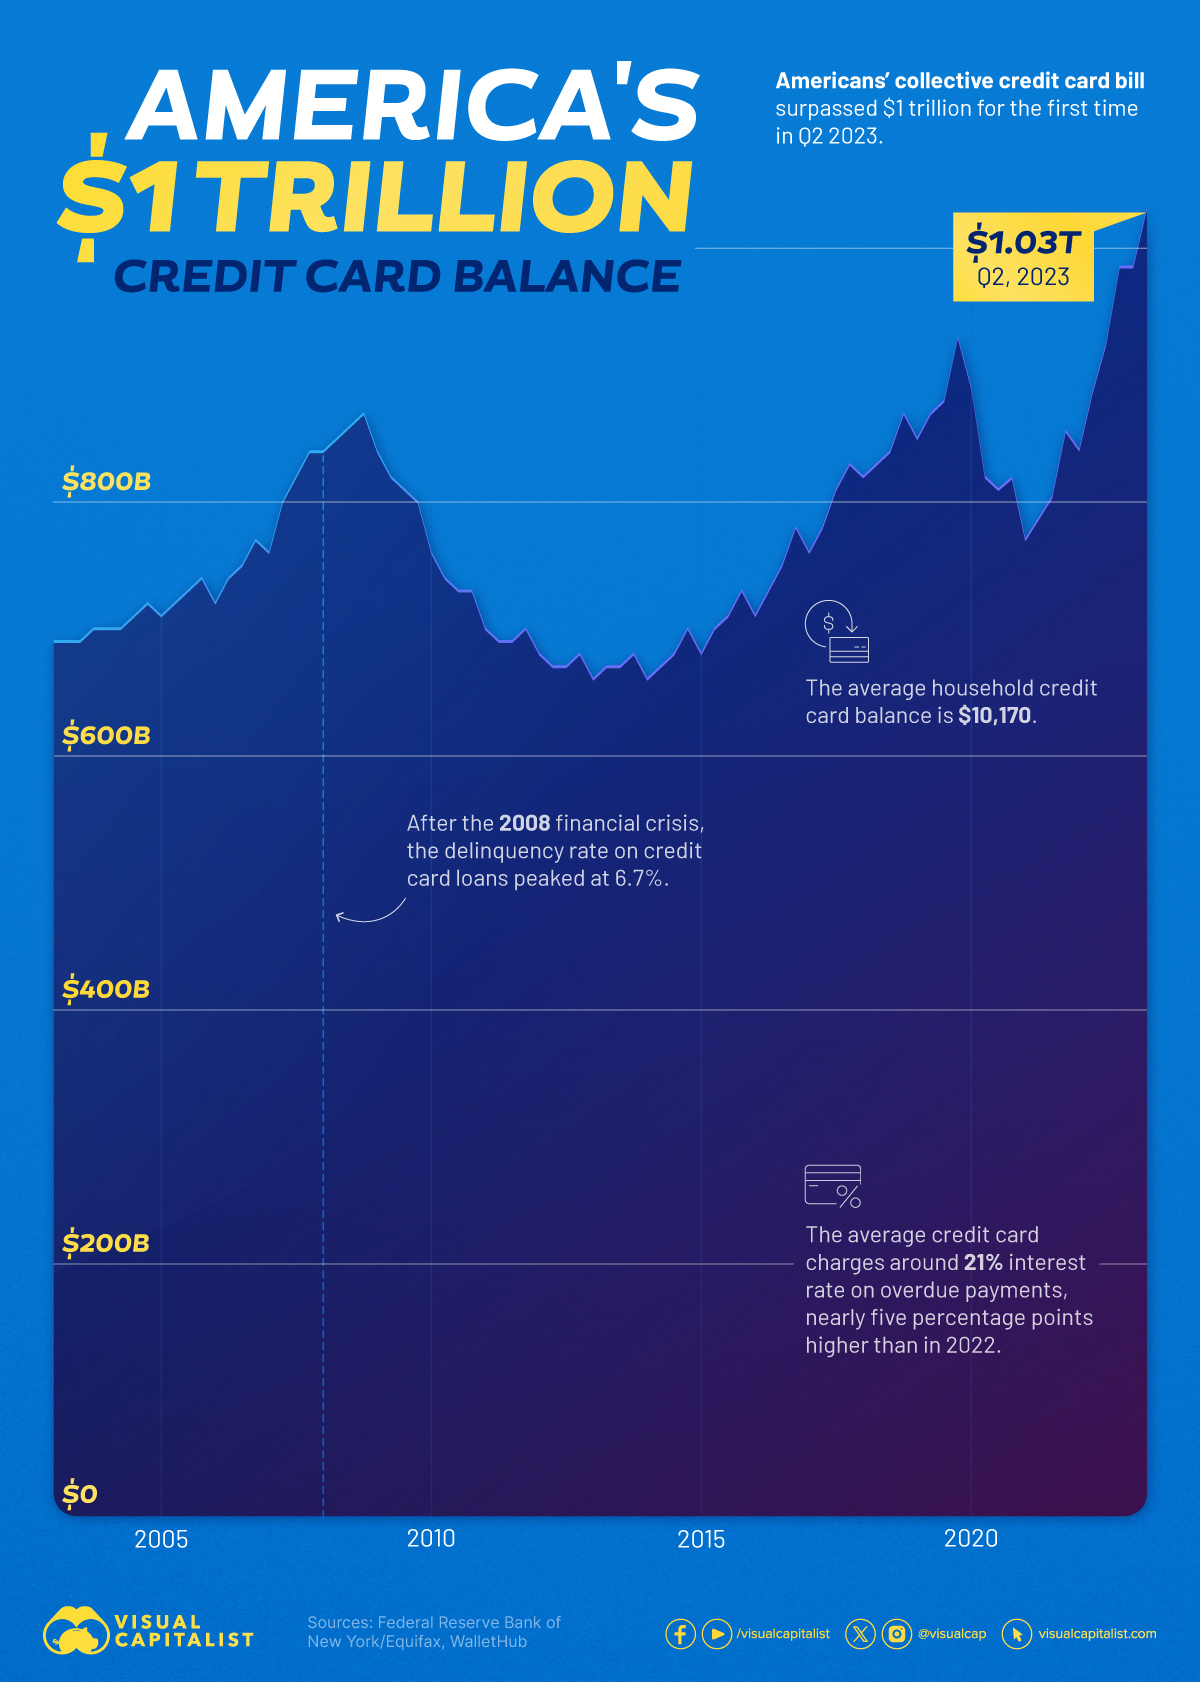
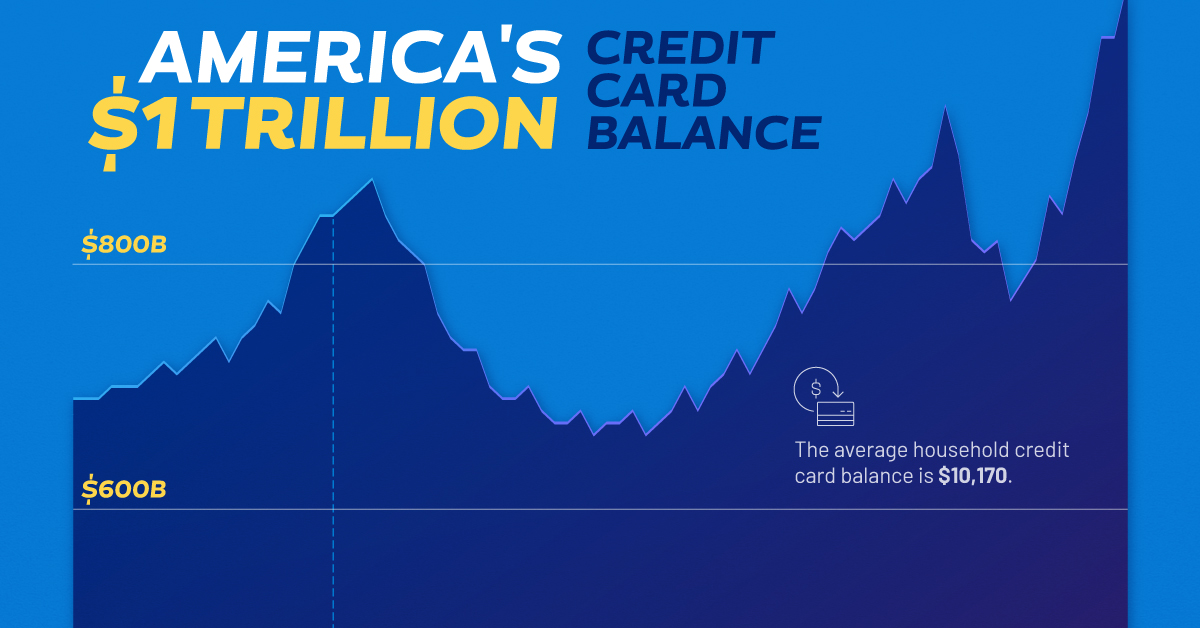
Americans’ collective credit card debt surpassed $1 trillion for the first time in Q2 2023.
Between April 1 and June 30, total credit card balances rose by $45 billion compared to Q1 2023, to $1.03 trillion.
This chart uses data from the Federal Reserve Bank of New York and WalletHub to illustrate the growing credit card debt in the United States.
Over $10,000 Balance per Household
After a sharp contraction in the first year of the pandemic, credit card balances have experienced seven consecutive quarters of year-over-year growth.
In Q2 2023, credit card balances saw the most significant increase among all debt types, including auto loans, student loans, and mortgages.
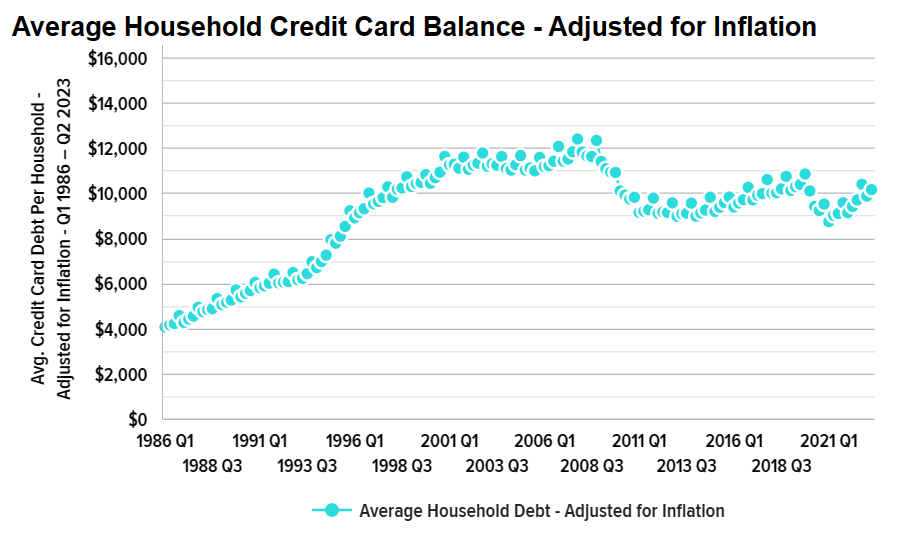
The average household credit card balance was $10,173.87 in June, $2,242.77 below the record set in Q4 2007.
As the Federal Reserve has increased interest rates at a record pace, banks have followed suit.
The average credit card charges around 21% interest rate on overdue payments, nearly five percentage points higher than in 2022.
Rising Balances May Present Challenges
Credit cards stand out as the most prevalent form of household debt in the U.S. and this prevalence is on an upward trajectory.
According to the Federal Reserve Bank of New York, credit card issuance has been steady over the last few years, averaging about 92 million newly issued cards each year between 2017 and 2019. The pandemic caused a sharp contraction in new credit card issuance, but lending returned across all credit score groups in 2021.
There are currently 70 million more credit card accounts open than in 2019. Approximately 69% of Americans now possess at least one credit card.
“American consumers have so far withstood the economic difficulties of the pandemic and post-pandemic periods with resilience,” New York Fed researchers wrote.
“However, rising balances may present challenges for some borrowers,” they added, “and the resumption of student loan payments this fall may add additional financial strain for many student loan borrowers.”


Money
Charted: Which City Has the Most Billionaires in 2024?
Just two countries account for half of the top 20 cities with the most billionaires. And the majority of the other half are found in Asia.


Charted: Which Country Has the Most Billionaires in 2024?
This was originally posted on our Voronoi app. Download the app for free on iOS or Android and discover incredible data-driven charts from a variety of trusted sources.
Some cities seem to attract the rich. Take New York City for example, which has 340,000 high-net-worth residents with investable assets of more than $1 million.
But there’s a vast difference between being a millionaire and a billionaire. So where do the richest of them all live?
Using data from the Hurun Global Rich List 2024, we rank the top 20 cities with the highest number of billionaires in 2024.
A caveat to these rich lists: sources often vary on figures and exact rankings. For example, in last year’s reports, Forbes had New York as the city with the most billionaires, while the Hurun Global Rich List placed Beijing at the top spot.
Ranked: Top 20 Cities with the Most Billionaires in 2024
The Chinese economy’s doldrums over the course of the past year have affected its ultra-wealthy residents in key cities.
Beijing, the city with the most billionaires in 2023, has not only ceded its spot to New York, but has dropped to #4, overtaken by London and Mumbai.
| Rank | City | Billionaires | Rank Change YoY |
|---|---|---|---|
| 1 | 🇺🇸 New York | 119 | +1 |
| 2 | 🇬🇧 London | 97 | +3 |
| 3 | 🇮🇳 Mumbai | 92 | +4 |
| 4 | 🇨🇳 Beijing | 91 | -3 |
| 5 | 🇨🇳 Shanghai | 87 | -2 |
| 6 | 🇨🇳 Shenzhen | 84 | -2 |
| 7 | 🇭🇰 Hong Kong | 65 | -1 |
| 8 | 🇷🇺 Moscow | 59 | No Change |
| 9 | 🇮🇳 New Delhi | 57 | +6 |
| 10 | 🇺🇸 San Francisco | 52 | No Change |
| 11 | 🇹🇭 Bangkok | 49 | +2 |
| 12 | 🇹🇼 Taipei | 45 | +2 |
| 13 | 🇫🇷 Paris | 44 | -2 |
| 14 | 🇨🇳 Hangzhou | 43 | -5 |
| 15 | 🇸🇬 Singapore | 42 | New to Top 20 |
| 16 | 🇨🇳 Guangzhou | 39 | -4 |
| 17T | 🇮🇩 Jakarta | 37 | +1 |
| 17T | 🇧🇷 Sao Paulo | 37 | No Change |
| 19T | 🇺🇸 Los Angeles | 31 | No Change |
| 19T | 🇰🇷 Seoul | 31 | -3 |
In fact all Chinese cities on the top 20 list have lost billionaires between 2023–24. Consequently, they’ve all lost ranking spots as well, with Hangzhou seeing the biggest slide (-5) in the top 20.
Where China lost, all other Asian cities—except Seoul—in the top 20 have gained ranks. Indian cities lead the way, with New Delhi (+6) and Mumbai (+3) having climbed the most.
At a country level, China and the U.S combine to make up half of the cities in the top 20. They are also home to about half of the world’s 3,200 billionaire population.
In other news of note: Hurun officially counts Taylor Swift as a billionaire, estimating her net worth at $1.2 billion.

-

 Sports1 week ago
The Highest Earning Athletes in Seven Professional Sports
-

 Countries2 weeks ago
Population Projections: The World’s 6 Largest Countries in 2075
-

 Markets2 weeks ago
The Top 10 States by Real GDP Growth in 2023
-

 Demographics2 weeks ago
The Smallest Gender Wage Gaps in OECD Countries
-

 United States2 weeks ago
Where U.S. Inflation Hit the Hardest in March 2024
-

 Green2 weeks ago
Top Countries By Forest Growth Since 2001
-

 United States2 weeks ago
Ranked: The Largest U.S. Corporations by Number of Employees
-

 Maps2 weeks ago
The Largest Earthquakes in the New York Area (1970-2024)