Money
Mapping Credit Card Delinquency Rates in the U.S. by State
![]() See this visualization first on the Voronoi app.
See this visualization first on the Voronoi app.
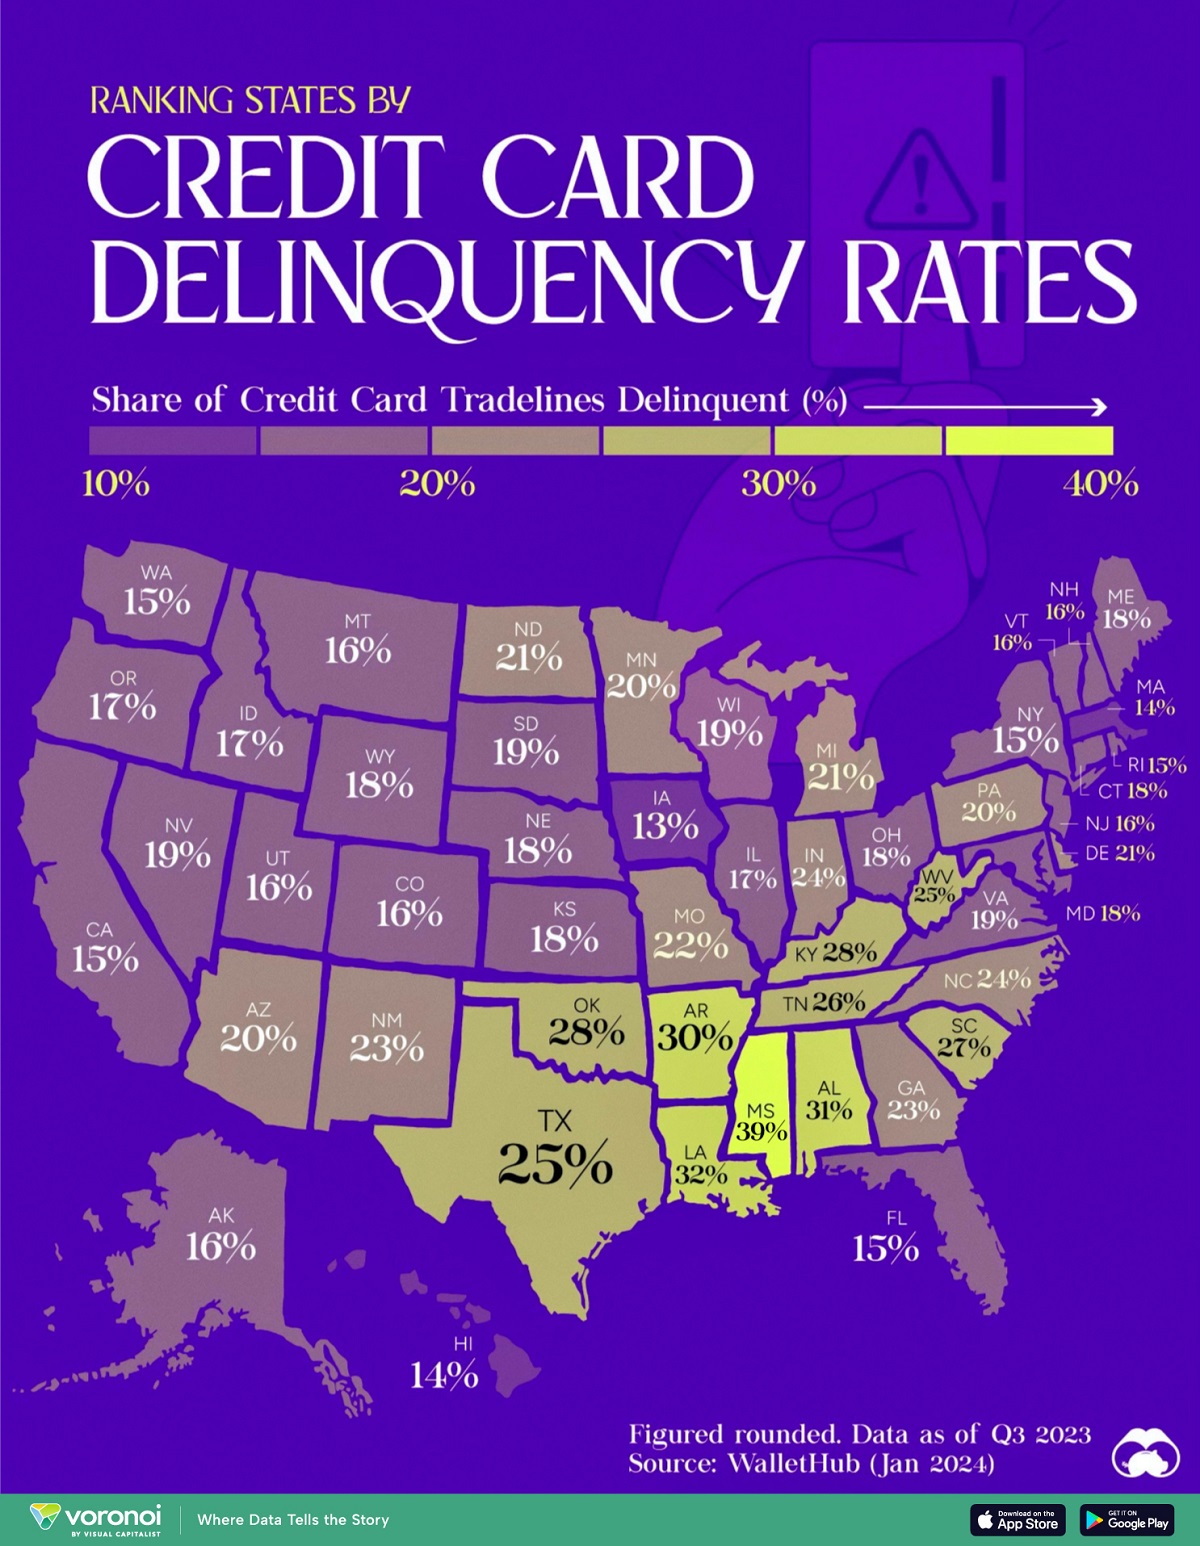
Credit Card Delinquency Rates in the U.S. by State
This was originally posted on our Voronoi app. Download the app for free on iOS or Android and discover incredible data-driven charts from a variety of trusted sources.
Credit card debt carries a hefty bill in America, and falling behind on payments can be extremely costly for cardholders.
This graphic shows credit card delinquency rates across 50 U.S. states, as of Q3 2023. This data comes from a WalletHub study published in January 2024.
Which States Have the Lowest and Highest Delinquency Rates?
Credit card delinquency is when a cardholder falls behind on required monthly payments. Credit agencies are often notified after two months of delinquent payments.
WalletHub examined proprietary user data on the average number of delinquent credit card tradelines—also known as credit accounts—across states. Here they are from lowest to highest:
| Rank | State | Share of Credit Card Tradelines Delinquent (%) |
|---|---|---|
| 1 | Iowa | 12.9 |
| 2 | Massachusetts | 13.9 |
| 3 | Hawaii | 13.9 |
| 4 | Rhode Island | 14.7 |
| 5 | Washington | 14.7 |
| 6 | Florida | 14.8 |
| 7 | New York | 14.9 |
| 8 | California | 15.1 |
| 9 | New Hampshire | 15.5 |
| 10 | Alaska | 15.6 |
| 11 | New Jersey | 15.6 |
| 12 | Colorado | 15.7 |
| 13 | Utah | 15.8 |
| 14 | Vermont | 16.1 |
| 15 | Montana | 16.1 |
| 16 | Illinois | 16.5 |
| 17 | Oregon | 16.6 |
| 18 | Idaho | 17.0 |
| 19 | Ohio | 17.5 |
| 20 | Connecticut | 17.8 |
| 21 | Maine | 18.0 |
| 22 | Nebraska | 18.1 |
| 23 | Wyoming | 18.1 |
| 24 | Maryland | 18.4 |
| 25 | Kansas | 18.4 |
| 26 | Wisconsin | 18.5 |
| 27 | Virginia | 18.7 |
| 28 | Nevada | 19.1 |
| 29 | South Dakota | 19.3 |
| 30 | Arizona | 19.8 |
| 31 | Minnesota | 19.8 |
| 32 | Pennsylvania | 20.2 |
| 33 | Michigan | 20.9 |
| 34 | North Dakota | 21.3 |
| 35 | Delaware | 21.4 |
| 36 | Missouri | 22.4 |
| 37 | New Mexico | 22.6 |
| 38 | Georgia | 23.1 |
| 39 | North Carolina | 24.0 |
| 40 | Indiana | 24.3 |
| 41 | Texas | 24.7 |
| 42 | West Virginia | 25.2 |
| 43 | Tennessee | 26.2 |
| 44 | South Carolina | 26.9 |
| 45 | Kentucky | 27.6 |
| 46 | Oklahoma | 28.2 |
| 47 | Arkansas | 30.1 |
| 48 | Alabama | 30.5 |
| 49 | Louisiana | 31.7 |
| 50 | Mississippi | 39.1 |
No state had credit delinquency rates of less than 10%, with Iowa coming the closest at 12.9%.
That puts Iowa ahead of wealthier states like Massachusetts (13.9%), Washington (14.7%), and New Hampshire (15.5%).
At the bottom end was Mississippi, which had 39% credit delinquency rates to end 2023. That’s well ahead of the next-lowest states Louisiana (31.7%) and Alabama (30.5%).
It’s notable that the American South had higher rates of delinquency almost across the board. The five states with the highest rates of credit card delinquency are all located in the southeastern region of the country, and Texas had a higher delinquency rate (25%) than other majorly populated states like Florida (14.8%) and New York (14.9%).


Money
Charted: Which City Has the Most Billionaires in 2024?
Just two countries account for half of the top 20 cities with the most billionaires. And the majority of the other half are found in Asia.


Charted: Which Country Has the Most Billionaires in 2024?
This was originally posted on our Voronoi app. Download the app for free on iOS or Android and discover incredible data-driven charts from a variety of trusted sources.
Some cities seem to attract the rich. Take New York City for example, which has 340,000 high-net-worth residents with investable assets of more than $1 million.
But there’s a vast difference between being a millionaire and a billionaire. So where do the richest of them all live?
Using data from the Hurun Global Rich List 2024, we rank the top 20 cities with the highest number of billionaires in 2024.
A caveat to these rich lists: sources often vary on figures and exact rankings. For example, in last year’s reports, Forbes had New York as the city with the most billionaires, while the Hurun Global Rich List placed Beijing at the top spot.
Ranked: Top 20 Cities with the Most Billionaires in 2024
The Chinese economy’s doldrums over the course of the past year have affected its ultra-wealthy residents in key cities.
Beijing, the city with the most billionaires in 2023, has not only ceded its spot to New York, but has dropped to #4, overtaken by London and Mumbai.
| Rank | City | Billionaires | Rank Change YoY |
|---|---|---|---|
| 1 | 🇺🇸 New York | 119 | +1 |
| 2 | 🇬🇧 London | 97 | +3 |
| 3 | 🇮🇳 Mumbai | 92 | +4 |
| 4 | 🇨🇳 Beijing | 91 | -3 |
| 5 | 🇨🇳 Shanghai | 87 | -2 |
| 6 | 🇨🇳 Shenzhen | 84 | -2 |
| 7 | 🇭🇰 Hong Kong | 65 | -1 |
| 8 | 🇷🇺 Moscow | 59 | No Change |
| 9 | 🇮🇳 New Delhi | 57 | +6 |
| 10 | 🇺🇸 San Francisco | 52 | No Change |
| 11 | 🇹🇭 Bangkok | 49 | +2 |
| 12 | 🇹🇼 Taipei | 45 | +2 |
| 13 | 🇫🇷 Paris | 44 | -2 |
| 14 | 🇨🇳 Hangzhou | 43 | -5 |
| 15 | 🇸🇬 Singapore | 42 | New to Top 20 |
| 16 | 🇨🇳 Guangzhou | 39 | -4 |
| 17T | 🇮🇩 Jakarta | 37 | +1 |
| 17T | 🇧🇷 Sao Paulo | 37 | No Change |
| 19T | 🇺🇸 Los Angeles | 31 | No Change |
| 19T | 🇰🇷 Seoul | 31 | -3 |
In fact all Chinese cities on the top 20 list have lost billionaires between 2023–24. Consequently, they’ve all lost ranking spots as well, with Hangzhou seeing the biggest slide (-5) in the top 20.
Where China lost, all other Asian cities—except Seoul—in the top 20 have gained ranks. Indian cities lead the way, with New Delhi (+6) and Mumbai (+3) having climbed the most.
At a country level, China and the U.S combine to make up half of the cities in the top 20. They are also home to about half of the world’s 3,200 billionaire population.
In other news of note: Hurun officially counts Taylor Swift as a billionaire, estimating her net worth at $1.2 billion.

-

 Education1 week ago
How Hard Is It to Get Into an Ivy League School?
-

 Technology2 weeks ago
Ranked: Semiconductor Companies by Industry Revenue Share
-

 Markets2 weeks ago
Ranked: The World’s Top Flight Routes, by Revenue
-

 Demographics2 weeks ago
Population Projections: The World’s 6 Largest Countries in 2075
-

 Markets2 weeks ago
The Top 10 States by Real GDP Growth in 2023
-

 Demographics2 weeks ago
The Smallest Gender Wage Gaps in OECD Countries
-

 Economy2 weeks ago
Where U.S. Inflation Hit the Hardest in March 2024
-

 Green2 weeks ago
Top Countries By Forest Growth Since 2001