Investor Education
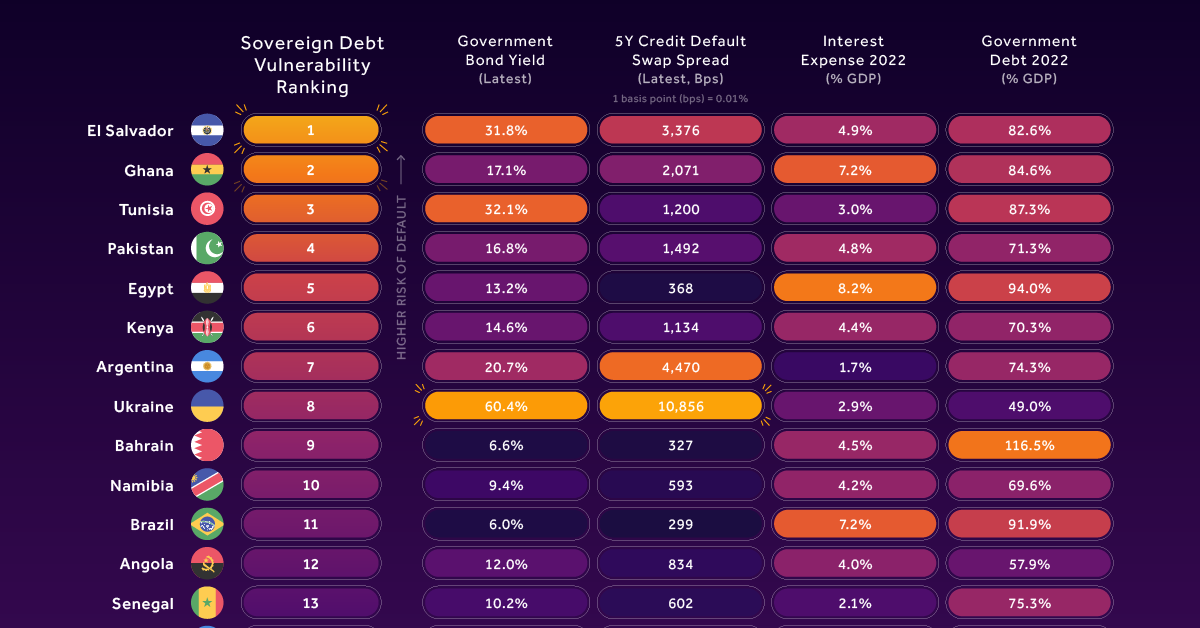
Countries with the Highest Default Risk in 2022
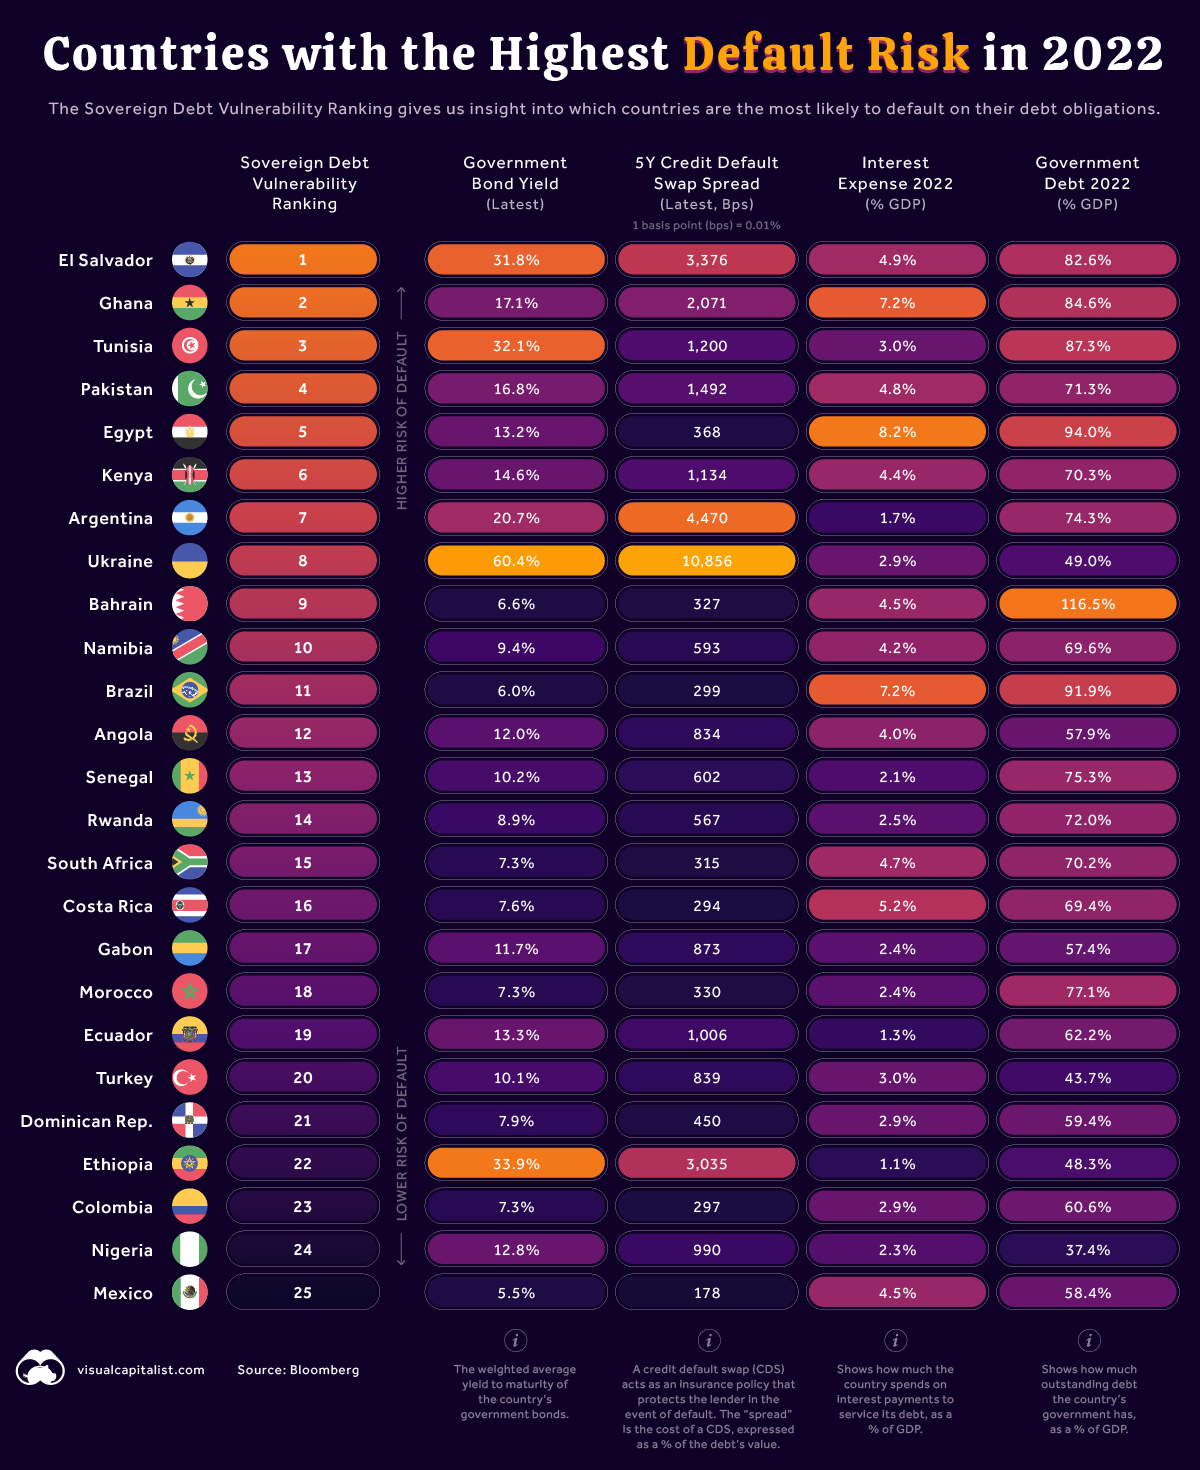
Countries with the Highest Default Risk in 2022
In May 2022, the South Asian nation of Sri Lanka defaulted on its debt for the first time. The country’s government was given a 30-day grace period to cover $78 million in unpaid interest, but ultimately failed to pay.
Not only does this impact Sri Lanka’s economic future, but it also raises an important question: which other countries are at risk of default?
To find out, we’ve used data from Bloomberg to rank the countries with the highest default risk.
The Sovereign Debt Vulnerability Ranking
Bloomberg’s Sovereign Debt Vulnerability Ranking is a composite measure of a country’s default risk. It’s based on four underlying metrics:
- Government bond yields (the weighted-average yield of the country’s dollar bonds)
- 5-year credit default swap (CDS) spread
- Interest expense as a percentage of GDP
- Government debt as a percentage of GDP
To better understand this ranking, let’s focus on Ukraine and El Salvador as examples.
| Country | Rank | Government Bond Yield (%) | 5Y CDS Spread | Interest Expense (% of GDP) | Government Debt (% of GDP) |
|---|---|---|---|---|---|
| 🇸🇻 El Salvador | 1 | 31.8% | 3,376 bps (33.76%) | 4.9% | 82.6% |
| 🇺🇦 Ukraine | 8 | 60.4% | 10,856 bps (100.85%) | 2.9% | 49% |
1 basis point (bps) = 0.01%
Why are Ukraine’s Bond Yields so High?
Ukraine has high default risk due to its ongoing conflict with Russia. To understand why, consider a scenario where Russia was to assume control of the country. If this happened, it’s possible that Ukraine’s existing debt obligations will never be repaid.
That scenario has prompted a sell-off of Ukrainian government bonds, pushing their value down to nearly 30 cents on the dollar. This means that a bond with face value of $100 could be purchased for $30.
Because yields move in the opposite direction of price, the average yield on these bonds has climbed to a very high 60.4%. As a point of comparison, the yield on a U.S. 10-year government bond is currently 2.9%.
What is a CDS Spread?
Credit default swaps (CDS) are a type of derivative (financial contract) that provides a lender with insurance in the event of a default. The seller of the CDS represents a third party between the lender (investors) and borrower (in this case, governments).
In exchange for receiving coverage, the buyer of a CDS pays a fee known as the spread, which is expressed in basis points (bps). If a CDS has a spread of 300 bps (3%), this means that to insure $100 in debt, the investor must pay $3 per year.
Applying this to Ukraine’s 5-year CDS spread of 10,856 bps (108.56%), an investor would need to pay $108.56 each year to insure $100 in debt. This suggests that the market has very little faith in Ukraine’s ability to avoid default.
Why is El Salvador Ranked Higher?
Despite having lower values in the two metrics discussed above, El Salvador ranks higher than Ukraine because of its larger interest expense and total government debt.
According to the data above, El Salvador has annual interest payments equal to 4.9% of its GDP, which is relatively high. Comparing to the U.S. once more, America’s federal interest costs amounted to 1.6% of GDP in 2020.
When totaled, El Salvador’s outstanding debts are equal to 82.6% of GDP. This is considered high by historical standards, but today it’s actually quite normal.
The next date to watch will be January 2023, as this is when the country’s $800 million sovereign bond reaches maturity. Recent research suggests that if El Salvador were to default, it would experience significant, yet temporary, negative effects.
Another Hot Topic for El Salvador: Bitcoin
In September 2021, El Salvador became the first country in the world to adopt bitcoin as legal tender. This means that Bitcoin is recognized by law as a means to settle debts and other obligations.
The International Monetary Fund (IMF) criticized this decision in early 2022, urging the country to revoke legal tender status. In hindsight, these warnings were wise, as Bitcoin’s value has fallen by 56% year-to-date.
While this isn’t directly related to El Salvador’s default risk, it does open potential avenues for relief. For instance, large players in the crypto space may be willing to assist the government to keep the concept of “nation-state bitcoin adoption” alive.


Investor Education
How MSCI Builds Thematic Indexes: A Step-by-Step Guide
From developing an index objective to choosing relevant stocks, this graphic breaks down how MSCI builds thematic indexes using examples.


How MSCI Builds Thematic Indexes: A Step-by-Step Guide
Have you ever wondered how MSCI builds its thematic indexes?
To capture long-term, structural trends that could drive business performance in the future, the company follows a systematic approach. This graphic from MSCI breaks down each step in the process used to create its thematic indexes.
Step 1: Develop an Index Objective
MSCI first builds a broad statement of what the theme aims to capture based on extensive research and insights from industry experts.
Steps 2 and 3: List Sub-Themes, Generate Keyword List
Together with experts, MSCI creates a list of sub-themes or “seedwords” to identify aligned business activities.
The team then assembles a collection of suitable documents describing the theme. Natural language processing efficiently analyzes word frequency and relevance to generate a more detailed set of keywords contextually similar to the seedwords.
Step 4: Find Relevant Companies
By analyzing financial reports, MSCI picks companies relevant to the theme using two methods:
- Direct approach: Revenue from a company’s business segment is considered 100% relevant if the segment name matches a theme keyword. Standard Industrial Classification (SIC) codes from these directly-matched segments make up the eligible SIC code list used in the indirect approach.
- Indirect approach: If a segment name doesn’t match theme keywords, MSCI will:
- Analyze the density of theme keywords mentioned in the company’s description. A minimum of two unique keywords is required.
- The keyword density determines a “discount factor” to reflect lower certainty in theme alignment.
- Revenue from business segments with an eligible SIC code, regardless of how they are named, is scaled down by the discount factor.
The total percentage of revenue applicable to the theme from both approaches determines a company’s relevance score.
Step 5: Select the Stocks
Finally, MSCI narrows down the stocks that will be included:
- Global parent universe: The ACWI Investable Market Index (IMI) is the starting point for standard thematic indexes.
- Relevance filter: The universe is filtered for companies with a relevance score of at least 25%.
- False positive control: Eligible companies that are mapped to un-related GICS sub-industries are removed.
Companies with higher relevance scores and market caps have a higher weighting in the index, with the maximum weighting for any one issuer capped at 5%. The final selected stocks span various sectors.
MSCI Thematic Indexes: Regularly Updated and Rules-Based
Once an index is built, it is reviewed semi-annually and updated based on:
- Changes to the parent index
- Changes at individual companies
- Theme developments based on expert input
Theme keywords are reviewed yearly in May. Overall, MSCI’s thematic index construction process is objective, scalable, and flexible. The process can be customized based on the theme(s) you want to capture.
Learn more about MSCI’s thematic indexes.

-

 Investor Education6 months ago
The 20 Most Common Investing Mistakes, in One Chart
Here are the most common investing mistakes to avoid, from emotionally-driven investing to paying too much in fees.
-

 Investor Education10 months ago
Visualizing BlackRock’s Top Equity Holdings
BlackRock is the world’s largest asset manager, with over $9 trillion in holdings. Here are the company’s top equity holdings.
-

 Investor Education11 months ago
10-Year Annualized Forecasts for Major Asset Classes
This infographic visualizes 10-year annualized forecasts for both equities and fixed income using data from Vanguard.
-

 Investor Education1 year ago
Visualizing 90 Years of Stock and Bond Portfolio Performance
How have investment returns for different portfolio allocations of stocks and bonds compared over the last 90 years?
-

 Investor Education2 years ago
Countries with the Highest Default Risk in 2022
In this infographic, we examine new data that ranks the top 25 countries by their default risk.
-

 Markets2 years ago
The Best Months for Stock Market Gains
This infographic analyzes over 30 years of stock market performance to identify the best and worst months for gains.


-

 Debt1 week ago
How Debt-to-GDP Ratios Have Changed Since 2000
-

 Markets2 weeks ago
Ranked: The World’s Top Flight Routes, by Revenue
-

 Countries2 weeks ago
Population Projections: The World’s 6 Largest Countries in 2075
-

 Markets2 weeks ago
The Top 10 States by Real GDP Growth in 2023
-

 Demographics2 weeks ago
The Smallest Gender Wage Gaps in OECD Countries
-

 United States2 weeks ago
Where U.S. Inflation Hit the Hardest in March 2024
-

 Green2 weeks ago
Top Countries By Forest Growth Since 2001
-

 United States2 weeks ago
Ranked: The Largest U.S. Corporations by Number of Employees