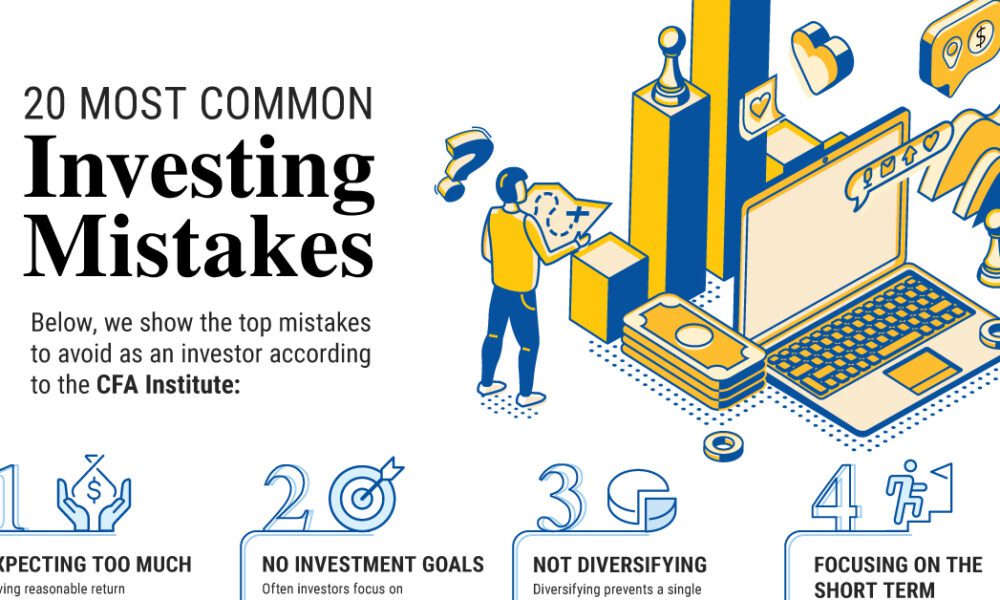
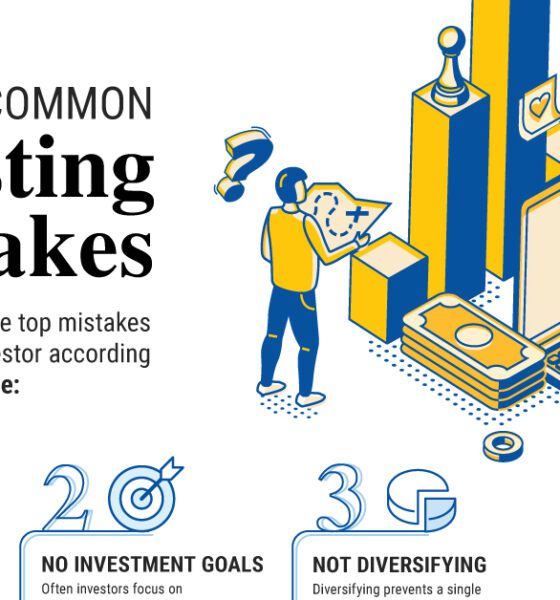
Here are the most common investing mistakes to avoid, from emotionally-driven investing to paying too much in fees.
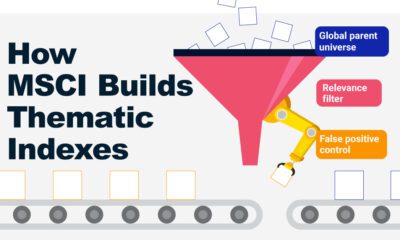

From developing an index objective to choosing relevant stocks, this graphic breaks down how MSCI builds thematic indexes using examples.
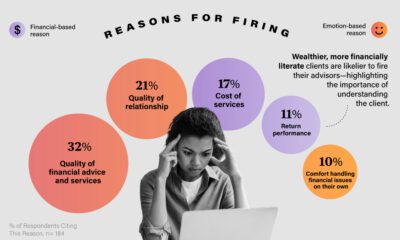

Firing an advisor is often driven by more than cost and performance factors. Here are the top reasons clients 'break up' with their advisors.
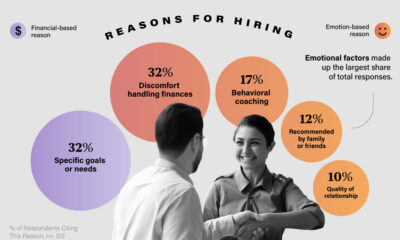

Here are the most common drivers for hiring a financial advisor, revealing that investor motivations go beyond just financial factors.
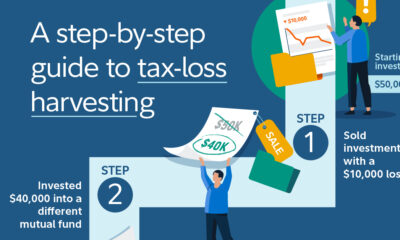

In Canada, tax-loss harvesting allows investors to turn losses into tax savings. This graphic breaks down how it works in four simple steps.
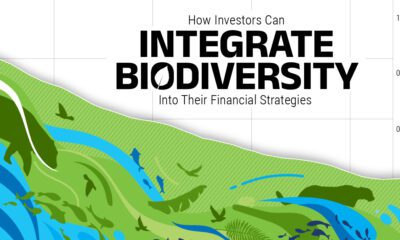

Despite contributing over half of global GDP, biodiversity is under severe pressure, and key species and ecosystems continue to be lost.
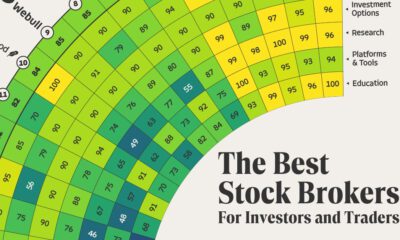

Whether you’re searching for low fees or an easy-to-use trading platform, this clear breakdown can help you find the best stock brokers.
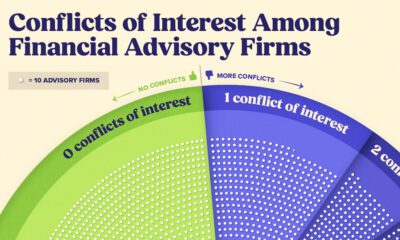

Financial advisors may not always act in your best interest. How common are conflicts of interest among U.S. firms?
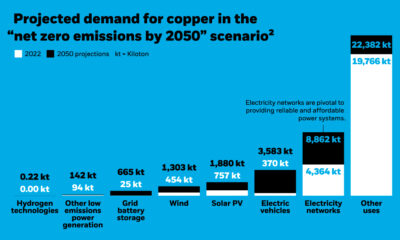

Explore three key insights into the future of the copper market, from soaring demand to potential supply constraints.
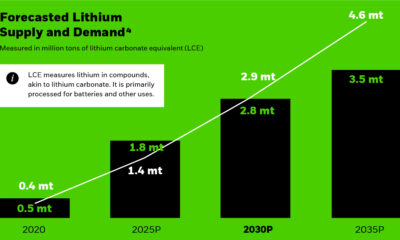

Discover three key insights that could shape the future of lithium, from soaring demand to supply challenges.


