Investor Education
10-Year Annualized Forecasts for Major Asset Classes
 Can I share this graphic?
 When do I need a license?
 Interested in this piece?
10-Year Annualized Forecasts for Major Asset Classes
While there’s no way of predicting the future, quantitative models can help us come up with a general idea of how different asset classes may perform in the future.
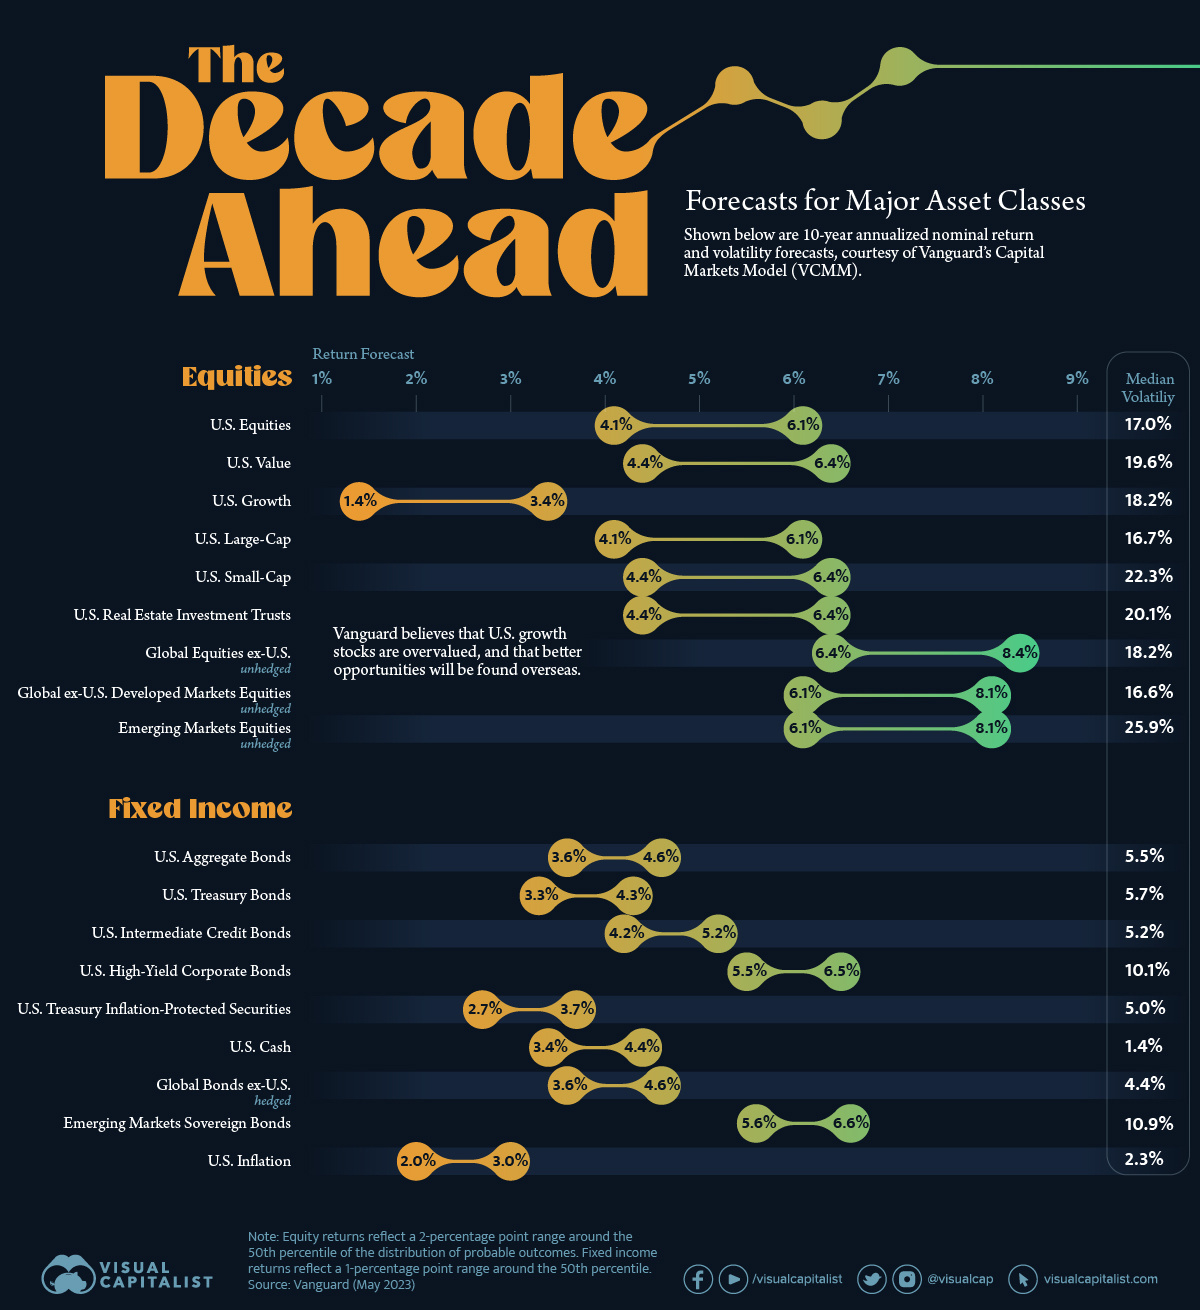
One example is Vanguard’s Capital Markets Model (VCMM), which has produced a set of 10-year annualized return forecasts for both equity and fixed income markets.
Visualized above, these projections were published on May 17, 2023, and are based on the March 31, 2023 running of the VCMM.
Equity Returns
The equity forecasts from this infographic are listed in the following table.
| Asset Class | Return Forecast (lower) | Return Forecast (upper) | Median Volatility |
|---|---|---|---|
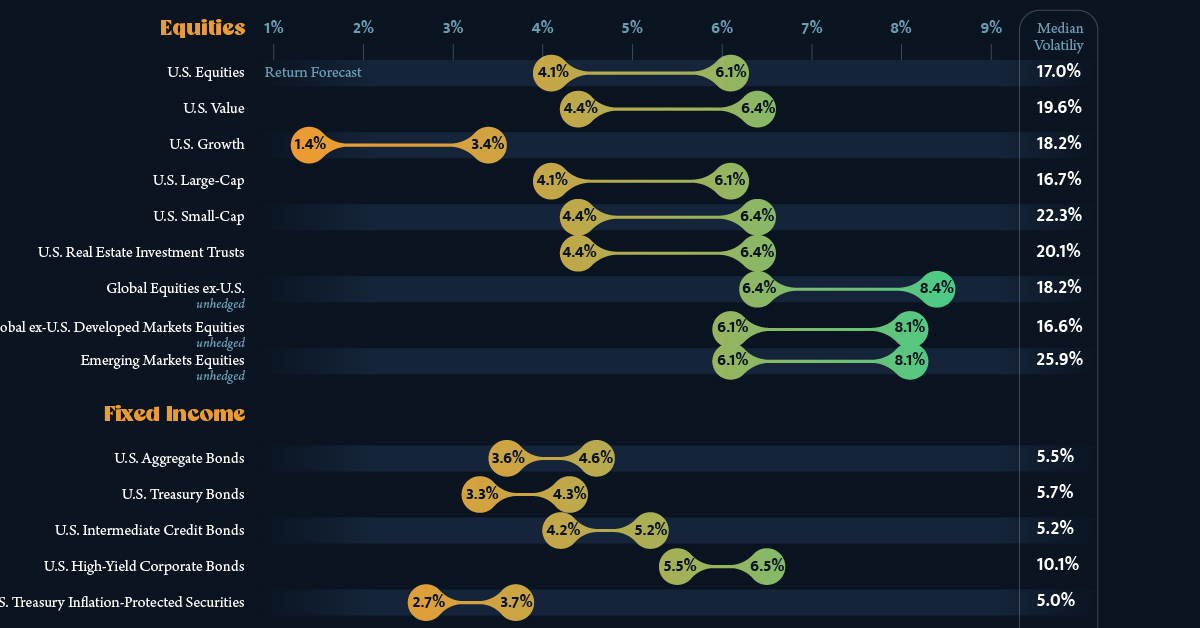
| U.S. Equities | 4.1% | 6.1% | 17.0% |
| U.S. Value | 4.4% | 6.4% | 19.6% |
| U.S. Growth | 1.4% | 3.4% | 18.2% |
| U.S. Large-Cap | 4.1% | 6.1% | 16.7% |
| U.S. Small-Cap | 4.4% | 6.4% | 22.3% |
| U.S. Real Estate Investment Trusts | 4.4% | 6.4% | 20.1% |
| Global Equities ex-U.S. (unhedged) | 6.4% | 8.4% | 18.2% |
| Global ex-U.S. Developed Markets Equities (unhedged) | 6.1% | 8.1% | 16.6% |
| Emerging Markets Equities (unhedged) | 6.1% | 8.1% | 25.9% |
A key takeaway here is that Vanguard expects international equities to outperform U.S. equities over the next decade.
We believe that the valuation-based expansion in U.S. equities is sowing the seeds for lower returns in the decade.
A valuation-based expansion refers to the increase in a company’s market value, rather than its intrinsic value. In other words, Vanguard doesn’t believe that current U.S. equity valuations are justified, and that this will dampen performance over the next decade.
Cited reasons for international outperformance include more favorable valuations, higher dividend payout ratios, and a potentially weaker U.S. dollar.
Fixed Income Returns
Now turning to fixed income, here are the forecasts used in this infographic.
| Asset Class | Return Forecast (lower) | Return Forecast (upper) | Median Volatility |
|---|---|---|---|
| U.S. Aggregate Bonds | 3.6% | 4.6% | 5.5% |
| U.S. Treasury Bonds | 3.3% | 4.3% | 5.7% |
| U.S. Intermediate Credit Bonds | 4.2% | 5.2% | 5.2% |
| U.S. High-Yield Corporate Bonds | 5.5% | 6.5% | 10.1% |
| U.S. Treasury Inflation-Protected Securities | 2.7% | 3.7% | 5.0% |
| U.S. Cash | 3.4% | 4.4% | 1.4% |
| Global Bonds ex-U.S. (hedged) | 3.6% | 4.6% | 4.4% |
| Emerging Markets Sovereign Bonds | 5.6% | 6.6% | 10.9% |
| U.S. Inflation | 2.0% | 3.0% | 2.3% |
Several bond indexes saw record-breaking declines in 2022 thanks to the unprecedented speed of interest rate hikes. Despite this turmoil, Vanguard believes that investors with a longer horizon will actually be better off as a result. The reasoning here is that cash flows can now be reinvested at much higher rates, which over time should offset any declines in an investor’s bond portfolio.
Vanguard also expects U.S. inflation to be contained over the next decade. The firm has confidence in the ability of central banks to keep inflation at their target rates (2% in most developed economies).


Investor Education
How MSCI Builds Thematic Indexes: A Step-by-Step Guide
From developing an index objective to choosing relevant stocks, this graphic breaks down how MSCI builds thematic indexes using examples.


How MSCI Builds Thematic Indexes: A Step-by-Step Guide
Have you ever wondered how MSCI builds its thematic indexes?
To capture long-term, structural trends that could drive business performance in the future, the company follows a systematic approach. This graphic from MSCI breaks down each step in the process used to create its thematic indexes.
Step 1: Develop an Index Objective
MSCI first builds a broad statement of what the theme aims to capture based on extensive research and insights from industry experts.
Steps 2 and 3: List Sub-Themes, Generate Keyword List
Together with experts, MSCI creates a list of sub-themes or “seedwords” to identify aligned business activities.
The team then assembles a collection of suitable documents describing the theme. Natural language processing efficiently analyzes word frequency and relevance to generate a more detailed set of keywords contextually similar to the seedwords.
Step 4: Find Relevant Companies
By analyzing financial reports, MSCI picks companies relevant to the theme using two methods:
- Direct approach: Revenue from a company’s business segment is considered 100% relevant if the segment name matches a theme keyword. Standard Industrial Classification (SIC) codes from these directly-matched segments make up the eligible SIC code list used in the indirect approach.
- Indirect approach: If a segment name doesn’t match theme keywords, MSCI will:
- Analyze the density of theme keywords mentioned in the company’s description. A minimum of two unique keywords is required.
- The keyword density determines a “discount factor” to reflect lower certainty in theme alignment.
- Revenue from business segments with an eligible SIC code, regardless of how they are named, is scaled down by the discount factor.
The total percentage of revenue applicable to the theme from both approaches determines a company’s relevance score.
Step 5: Select the Stocks
Finally, MSCI narrows down the stocks that will be included:
- Global parent universe: The ACWI Investable Market Index (IMI) is the starting point for standard thematic indexes.
- Relevance filter: The universe is filtered for companies with a relevance score of at least 25%.
- False positive control: Eligible companies that are mapped to un-related GICS sub-industries are removed.
Companies with higher relevance scores and market caps have a higher weighting in the index, with the maximum weighting for any one issuer capped at 5%. The final selected stocks span various sectors.
MSCI Thematic Indexes: Regularly Updated and Rules-Based
Once an index is built, it is reviewed semi-annually and updated based on:
- Changes to the parent index
- Changes at individual companies
- Theme developments based on expert input
Theme keywords are reviewed yearly in May. Overall, MSCI’s thematic index construction process is objective, scalable, and flexible. The process can be customized based on the theme(s) you want to capture.
Learn more about MSCI’s thematic indexes.

-

 Investor Education6 months ago
The 20 Most Common Investing Mistakes, in One Chart
Here are the most common investing mistakes to avoid, from emotionally-driven investing to paying too much in fees.
-

 Investor Education10 months ago
Visualizing BlackRock’s Top Equity Holdings
BlackRock is the world’s largest asset manager, with over $9 trillion in holdings. Here are the company’s top equity holdings.
-

 Investor Education11 months ago
10-Year Annualized Forecasts for Major Asset Classes
This infographic visualizes 10-year annualized forecasts for both equities and fixed income using data from Vanguard.
-

 Investor Education1 year ago
Visualizing 90 Years of Stock and Bond Portfolio Performance
How have investment returns for different portfolio allocations of stocks and bonds compared over the last 90 years?
-

 Investor Education2 years ago
Countries with the Highest Default Risk in 2022
In this infographic, we examine new data that ranks the top 25 countries by their default risk.
-

 Markets2 years ago
The Best Months for Stock Market Gains
This infographic analyzes over 30 years of stock market performance to identify the best and worst months for gains.

-

 Debt1 week ago
How Debt-to-GDP Ratios Have Changed Since 2000
-

 Markets2 weeks ago
Ranked: The World’s Top Flight Routes, by Revenue
-

 Countries2 weeks ago
Population Projections: The World’s 6 Largest Countries in 2075
-

 Markets2 weeks ago
The Top 10 States by Real GDP Growth in 2023
-

 Demographics2 weeks ago
The Smallest Gender Wage Gaps in OECD Countries
-

 United States2 weeks ago
Where U.S. Inflation Hit the Hardest in March 2024
-

 Green2 weeks ago
Top Countries By Forest Growth Since 2001
-

 United States2 weeks ago
Ranked: The Largest U.S. Corporations by Number of Employees