Markets
The World’s Biggest Mutual Fund and ETF Providers


The Briefing
- The 10 largest mutual fund and ETF providers did not change from 2021 to 2022.
- Vanguard and iShares, the top two brands, both saw net inflows in 2022.
The World’s Biggest Mutual Fund and ETF Providers
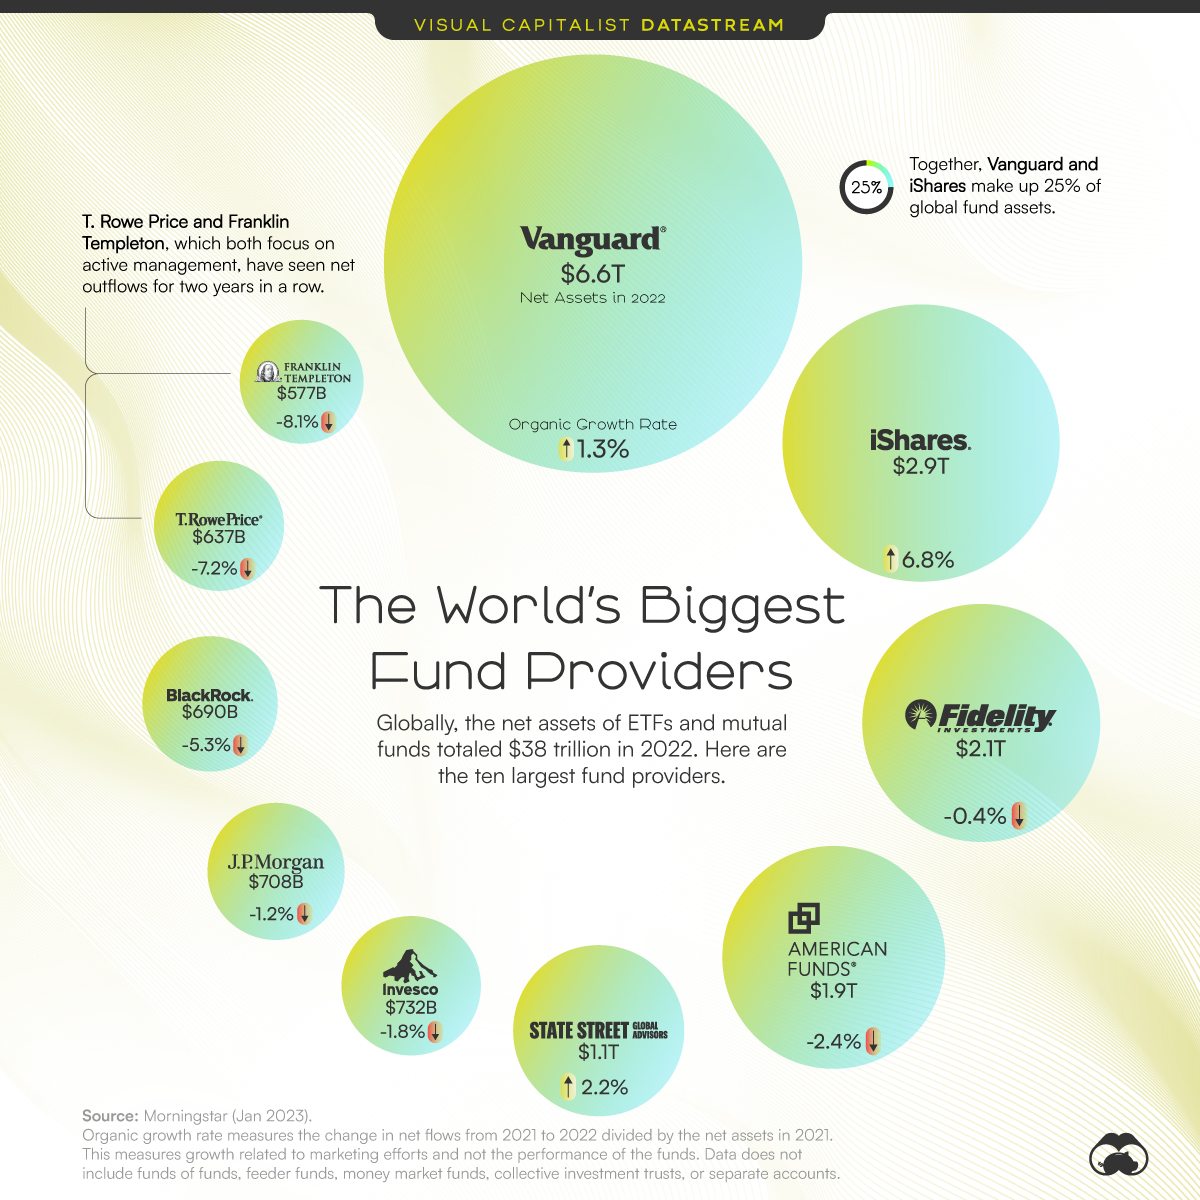
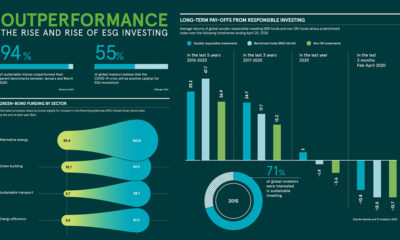
The global net assets of mutual fund and ETF providers totaled $38 trillion in 2022. Despite its massive size, the industry is dominated by a relatively small number of brands.
This graphic uses data from Morningstar to show the largest fund brands and their growth rates in 2022.
The Biggest Get Bigger
Below, we rank mutual fund and ETF brands by net assets and show their organic growth rate.
The organic growth rate measures the change in net flows, which reflects growth related to marketing efforts and not the market performance of the provider’s funds.
| Rank | Fund Provider | Net Assets in 2022 | Organic Growth Rate (2021-2022) |
|---|---|---|---|
| 1 | Vanguard | $6.6T | 1.3% |
| 2 | iShares | $2.9T | 6.8% |
| 3 | Fidelity | $2.1T | -0.4% |
| 4 | American Funds | $1.9T | -2.4% |
| 5 | State Street | $1.1T | 2.2% |
| 6 | Invesco | $732B | -1.8% |
| 7 | JPMorgan | $708B | -1.2% |
| 8 | BlackRock | $690B | -5.3% |
| 9 | T. Rowe Price | $637B | -7.2% |
| 10 | Franklin Templeton | $577B | -8.1% |
Vanguard and iShares continue to dominate the list and account for 25% of mutual fund and ETF net assets globally. Both saw net inflows, though iShares’ growth rate was much higher. It collected $222B, more than double the $101 billion that Vanguard received.
State Street, the fifth-largest fund brand, was the only other name on the list to see net inflow. The company manages the SPDR S&P 500 ETF, which is the largest ETF in the world. It was a top pick for retail investors in early 2023.
The smallest of the giants—T. Rowe Price and Franklin Templeton—saw net outflows for the second year in a row. Both firms focus on active management, a strategy designed to outperform the general market through the decisions of investment managers.
Shifting Preferences: From Mutual Fund to ETF
The decline of brands focused on active management reflects a larger trend within the industry. In 2022, investors heavily favored passive funds and ETFs over mutual funds and active funds.
This could be due to the higher fees and long-term underperformance of many active funds.
| Fund Type | Inflows (+) or Outflows (-) in 2022 |
|---|---|
| Mutual Funds | -$1.3T |
| Actively-Managed Funds | -$349B |
| ETFs | +$754B |
| Indexed (Passive) Funds | +$348B |
Passive funds now comprise 38% of global assets, up from 19% in 2013.
Typically, passive funds have very low expense ratios that limit the fees providers can earn. Existing brands also have large economies of scale that would be difficult for new entrants to replicate. For these reasons, fewer firms compete in passive management and this is ultimately leading to more consolidation in the industry.
Fortunately, investors have benefited from the cost-effective and efficient path to investment ownership that passive funds provide. In 2022, the average expense ratio of an actively-managed equity mutual fund was 0.66%, while the average for an index equity mutual fund was 0.05%.
On the flip side, some experts have expressed concerns that industry consolidation reduces financial stability. The Federal Reserve states that if a large firm experienced a significant event, such as a cybersecurity breach, it could “lead to sudden massive redemptions from that firm’s funds and thus potentially from the asset management industry as a whole.”
Where Does This Data Come From?
Source: Morningstar Global Fund Flows Report
Data note: Organic growth rate measures the change in net flows from 2021 to 2022 divided by the net assets in 2021. This measures growth related to marketing efforts and not the performance of the funds. Data does not include funds of funds, feeder funds, money market funds, collective investment trusts, or separate accounts.


Markets
The European Stock Market: Attractive Valuations Offer Opportunities
On average, the European stock market has valuations that are nearly 50% lower than U.S. valuations. But how can you access the market?


European Stock Market: Attractive Valuations Offer Opportunities
Europe is known for some established brands, from L’Oréal to Louis Vuitton. However, the European stock market offers additional opportunities that may be lesser known.
The above infographic, sponsored by STOXX, outlines why investors may want to consider European stocks.
Attractive Valuations
Compared to most North American and Asian markets, European stocks offer lower or comparable valuations.
| Index | Price-to-Earnings Ratio | Price-to-Book Ratio |
|---|---|---|
| EURO STOXX 50 | 14.9 | 2.2 |
| STOXX Europe 600 | 14.4 | 2 |
| U.S. | 25.9 | 4.7 |
| Canada | 16.1 | 1.8 |
| Japan | 15.4 | 1.6 |
| Asia Pacific ex. China | 17.1 | 1.8 |
Data as of February 29, 2024. See graphic for full index names. Ratios based on trailing 12 month financials. The price to earnings ratio excludes companies with negative earnings.
On average, European valuations are nearly 50% lower than U.S. valuations, potentially offering an affordable entry point for investors.
Research also shows that lower price ratios have historically led to higher long-term returns.
Market Movements Not Closely Connected
Over the last decade, the European stock market had low-to-moderate correlation with North American and Asian equities.
The below chart shows correlations from February 2014 to February 2024. A value closer to zero indicates low correlation, while a value of one would indicate that two regions are moving in perfect unison.
| EURO STOXX 50 | STOXX EUROPE 600 | U.S. | Canada | Japan | Asia Pacific ex. China |
|
|---|---|---|---|---|---|---|
| EURO STOXX 50 | 1.00 | 0.97 | 0.55 | 0.67 | 0.24 | 0.43 |
| STOXX EUROPE 600 | 1.00 | 0.56 | 0.71 | 0.28 | 0.48 | |
| U.S. | 1.00 | 0.73 | 0.12 | 0.25 | ||
| Canada | 1.00 | 0.22 | 0.40 | |||
| Japan | 1.00 | 0.88 | ||||
| Asia Pacific ex. China | 1.00 |
Data is based on daily USD returns.
European equities had relatively independent market movements from North American and Asian markets. One contributing factor could be the differing sector weights in each market. For instance, technology makes up a quarter of the U.S. market, but health care and industrials dominate the broader European market.
Ultimately, European equities can enhance portfolio diversification and have the potential to mitigate risk for investors.
Tracking the Market
For investors interested in European equities, STOXX offers a variety of flagship indices:
| Index | Description | Market Cap |
|---|---|---|
| STOXX Europe 600 | Pan-regional, broad market | €10.5T |
| STOXX Developed Europe | Pan-regional, broad-market | €9.9T |
| STOXX Europe 600 ESG-X | Pan-regional, broad market, sustainability focus | €9.7T |
| STOXX Europe 50 | Pan-regional, blue-chip | €5.1T |
| EURO STOXX 50 | Eurozone, blue-chip | €3.5T |
Data is as of February 29, 2024. Market cap is free float, which represents the shares that are readily available for public trading on stock exchanges.
The EURO STOXX 50 tracks the Eurozone’s biggest and most traded companies. It also underlies one of the world’s largest ranges of ETFs and mutual funds. As of November 2023, there were €27.3 billion in ETFs and €23.5B in mutual fund assets under management tracking the index.
“For the past 25 years, the EURO STOXX 50 has served as an accurate, reliable and tradable representation of the Eurozone equity market.”
— Axel Lomholt, General Manager at STOXX
Partnering with STOXX to Track the European Stock Market
Are you interested in European equities? STOXX can be a valuable partner:
- Comprehensive, liquid and investable ecosystem
- European heritage, global reach
- Highly sophisticated customization capabilities
- Open architecture approach to using data
- Close partnerships with clients
- Part of ISS STOXX and Deutsche Börse Group
With a full suite of indices, STOXX can help you benchmark against the European stock market.
Learn how STOXX’s European indices offer liquid and effective market access.

-

 Economy3 days ago
Economic Growth Forecasts for G7 and BRICS Countries in 2024
The IMF has released its economic growth forecasts for 2024. How do the G7 and BRICS countries compare?
-

 Markets2 weeks ago
U.S. Debt Interest Payments Reach $1 Trillion
U.S. debt interest payments have surged past the $1 trillion dollar mark, amid high interest rates and an ever-expanding debt burden.
-

 United States2 weeks ago
Ranked: The Largest U.S. Corporations by Number of Employees
We visualized the top U.S. companies by employees, revealing the massive scale of retailers like Walmart, Target, and Home Depot.
-

 Markets2 weeks ago
The Top 10 States by Real GDP Growth in 2023
This graphic shows the states with the highest real GDP growth rate in 2023, largely propelled by the oil and gas boom.
-

 Markets2 weeks ago
Ranked: The World’s Top Flight Routes, by Revenue
In this graphic, we show the highest earning flight routes globally as air travel continued to rebound in 2023.
-

 Markets3 weeks ago
Ranked: The Most Valuable Housing Markets in America
The U.S. residential real estate market is worth a staggering $47.5 trillion. Here are the most valuable housing markets in the country.


-

 Debt1 week ago
How Debt-to-GDP Ratios Have Changed Since 2000
-
Markets2 weeks ago
Ranked: The World’s Top Flight Routes, by Revenue
-

 Countries2 weeks ago
Population Projections: The World’s 6 Largest Countries in 2075
-
Markets2 weeks ago
The Top 10 States by Real GDP Growth in 2023
-

 Demographics2 weeks ago
The Smallest Gender Wage Gaps in OECD Countries
-

 United States2 weeks ago
Where U.S. Inflation Hit the Hardest in March 2024
-

 Green2 weeks ago
Top Countries By Forest Growth Since 2001
-
United States2 weeks ago
Ranked: The Largest U.S. Corporations by Number of Employees