Green
New Waves: The ESG Megatrend Meets Green Bonds
New Waves: The ESG Megatrend Meets Green Bonds
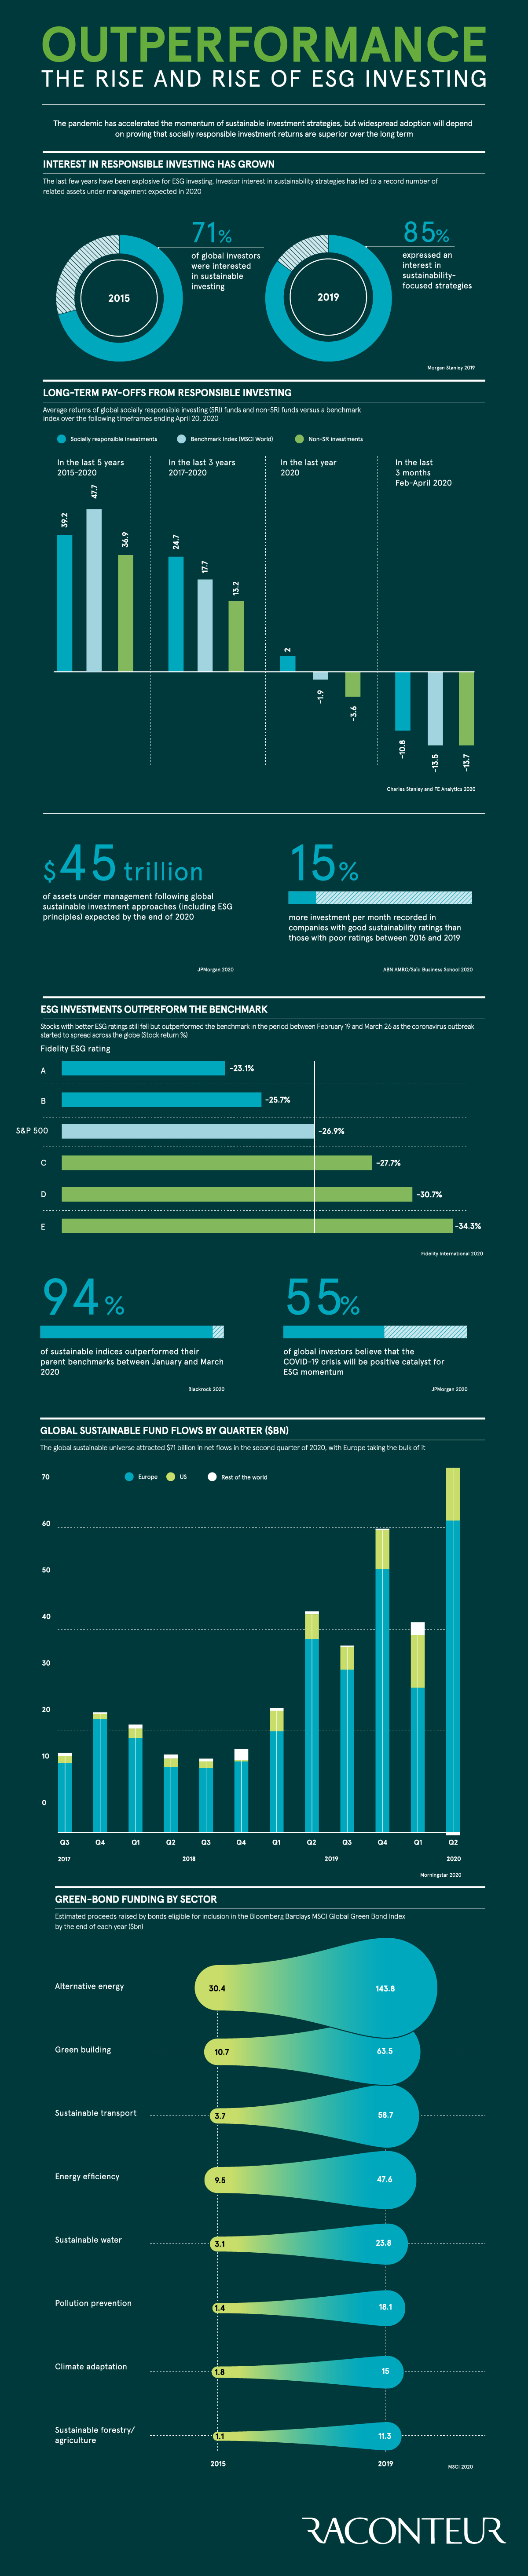
It’s clear that sustainable investing has been thrown into the limelight.
Increasingly, investors are seeing both the financial and social imperative for sustainable investing. In particular, the rapid growth of green bonds—a fixed income investment that is designed to raise funds for the climate or environment—is booming.
The above infographic from Raconteur navigates the growing green bond market against the backdrop of the broader ESG (environmental, social, and governance) investing shift.
Gathering Steam
By the end of 2020, $45 trillion in assets will adhere to sustainable practices, including ESG principles.
Despite the loss of confidence from COVID-19, investors flocked to sustainable-focused funds.In fact, global fund flows hit record levels for Q2 of 2020—surpassing $71 billion.
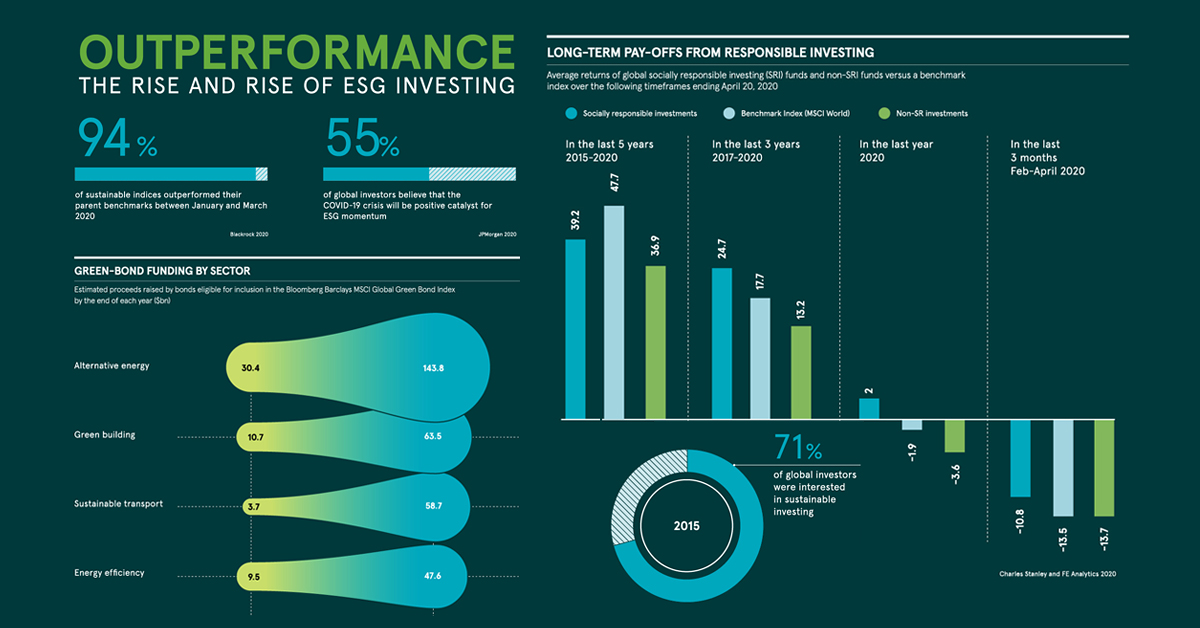
The fund flows are not without financial warrant. Between April 2015 and April 2019, average returns of socially responsible investments (SRI) outperformed their non-SRI peers. At the same time, 94% of sustainable indices realized stronger returns than their benchmarks between January and March 2020.
The accelerating demand for sustainable investments may seem like old news, but green bonds offer a new avenue.
What Are Green Bonds?
Green bonds raise money for climate and environmental projects, and are issued by governments, corporations, and financial institutions.
Multilateral development banks, which include the European Investment Bank and the World Bank, initially brought them to market in 2007, though they had a slow start. However, in 2019, new issues of green bonds topped $258 billion worldwide—jumping 51% in one year.
Across the green bond market there is a broad spectrum of different debt instruments. These include private placements, covered bonds, and green loans.
Green private placements occur when the sale of bonds are made to private investors, rather than through public offerings. Green covered bonds, on the other hand, are bonds that are backed by a group of assets that are sustainably-focused. Green loans are forms of loans that are meant to finance green projects.
Overall, green bonds can be diversified across a number of different sectors.
The Top Purposes for Green Bonds
What are the top sectors for green bond issuance?
| Category | 2015 | 2019 |
|---|---|---|
| Alternative energy | $30.4B | $143.8B |
| Green building | $10.7B | $63.5B |
| Sustainable transport | $3.7B | $58.7B |
| Energy efficiency | $9.5B | $47.6B |
| Sustainable water | $3.1B | $23.8B |
| Pollution prevention | $1.4B | $18.1B |
| Climate adaptation | $1.8B | $15.0B |
| Sustainable forestry/agriculture | $1.1B | $11.3B |
Source: MSCI
Alternative energy, accounting for over $143 billion in green bonds, outpaces all other sectors by a wide margin. Within four years, renewable energy bond issuance has more than quadrupled.
Meanwhile, green building bonds are garnering attention. These instruments finance the construction of energy efficient buildings. Within the industry, a notable green building certification system is the LEED standard, also internationally recognized. Often, real estate investment trusts (REITs) are involved in issuing green building bonds.
Interestingly, Big Tech is also becoming more active within the green bond landscape. Google’s parent company, Alphabet, has issued a record $5.8 billion in corporate sustainability bonds to fund everything from energy efficiency projects to affordable housing.
The Top 10 Countries for Green Bonds
On a country-by-country level, green bonds are most common in the U.S., China, and France.
| Rank | Country | Green Bond Issuance | 2018-2019 Change (Amount) |
|---|---|---|---|
| 1 | 🇺🇸U.S. | $50.6B | 44% |
| 2 | 🇨🇳China | $30.1B | 1% |
| 3 | 🇫🇷France | $29.5B | 113% |
| 4 | 🇩🇪Germany | $18.7B | 144% |
| 5 | 🇳🇱Netherlands | $15.1B | 105% |
| 6 | 🇸🇪Sweden | $10.3B | 66% |
| 7 | 🇯🇵Japan | $7.2B | 73% |
| 8 | 🇨🇦Canada | $7B | 63% |
| 9 | 🇮🇹Italy | $6.8B | 128% |
| 10 | 🇪🇸Spain | $6.5B | 3% |
| Top 10 Total | $181.8B | 49% |
Source: Climate Bonds Initiative
Germany issued its first multi-billion dollar government green bonds in just 2019. One catalyst behind this was the European Central Bank’s announcement that the environment would become a “mission critical” priority going forward.
This may contribute to the fact that both Germany and France saw the biggest change between 2018 and 2019.
Opening the Floodgates
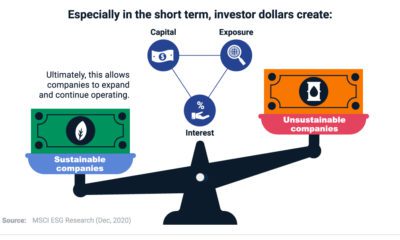
As sustainable investing becomes front and center on the global agenda, questions about its impact on returns have arisen.
During times of both extreme exuberance and market crisis, companies with higher sustainability ratings have outperformed their respective benchmark. However, there is still a long way to go. Even with the record issuance of green bonds in 2019, they make up just 3% of all global bonds issued.
As demand for sustainable investments quickly grows, could it spell a watershed decade ahead for green bonds?


Green
The Carbon Footprint of Major Travel Methods
Going on a cruise ship and flying domestically are the most carbon-intensive travel methods.


The Carbon Footprint of Major Travel Methods
This was originally posted on our Voronoi app. Download the app for free on iOS or Android and discover incredible data-driven charts from a variety of trusted sources.
Did you know that transport accounts for nearly one-quarter of global energy-related carbon dioxide (CO₂) emissions?
This graphic illustrates the carbon footprints of major travel methods measured in grams of carbon dioxide equivalent (CO₂e) emitted per person to travel one kilometer. This includes both CO₂ and other greenhouse gases.
Data is sourced from Our World in Data, the UK Government’s Department for Energy Security and Net Zero, and The International Council on Clean Transportation, as of December 2022.
These figures should be interpreted as approximations, rather than exact numbers. There are many variables at play that determine the actual carbon footprint in any individual case, including vehicle type or model, occupancy, energy mix, and even weather.
Cruise Ships are the Most Carbon-Intensive Travel Method
According to these estimates, taking a cruise ship, flying domestically, and driving alone are some of the most carbon-intensive travel methods.
Cruise ships typically use heavy fuel oil, which is high in carbon content. The average cruise ship weighs between 70,000 to 180,000 metric tons, meaning they require large engines to get moving.
These massive vessels must also generate power for onboard amenities such as lighting, air conditioning, and entertainment systems.
Short-haul flights are also considered carbon-intensive due to the significant amount of fuel consumed during initial takeoff and climbing altitude, relative to a lower amount of cruising.
| Transportation method | CO₂ equivalent emissions per passenger km |
|---|---|
| Cruise Ship | 250 |
| Short-haul flight (i.e. within a U.S. state or European country) | 246 |
| Diesel car | 171 |
| Gas car | 170 |
| Medium-haul flight (i.e. international travel within Europe, or between U.S. states) | 151 |
| Long-haul flight (over 3,700 km, about the distance from LA to NY) | 147 |
| Motorbike | 113 |
| Bus (average) | 96 |
| Plug-in hybrid | 68 |
| Electric car | 47 |
| National rail | 35 |
| Tram | 28 |
| London Underground | 27 |
| Ferry (foot passenger) | 19 |
| Eurostar (International rail) | 4.5 |
Are EVs Greener?
Many experts agree that EVs produce a lower carbon footprint over time versus traditional internal combustion engine (ICE) vehicles.
However, the batteries in electric vehicles charge on the power that comes straight off the electrical grid—which in many places may be powered by fossil fuels. For that reason, the carbon footprint of an EV will depend largely on the blend of electricity sources used for charging.
There are also questions about how energy-intensive it is to build EVs compared to a comparable ICE vehicle.

-

 Debt1 week ago
How Debt-to-GDP Ratios Have Changed Since 2000
-

 Markets2 weeks ago
Ranked: The World’s Top Flight Routes, by Revenue
-

 Countries2 weeks ago
Population Projections: The World’s 6 Largest Countries in 2075
-

 Markets2 weeks ago
The Top 10 States by Real GDP Growth in 2023
-

 Demographics2 weeks ago
The Smallest Gender Wage Gaps in OECD Countries
-

 United States2 weeks ago
Where U.S. Inflation Hit the Hardest in March 2024
-

 Green2 weeks ago
Top Countries By Forest Growth Since 2001
-

 United States2 weeks ago
Ranked: The Largest U.S. Corporations by Number of Employees