Green
Chart: Is ESG Investing in Decline?
Subscribe to the Advisor Channel free mailing list for more like this
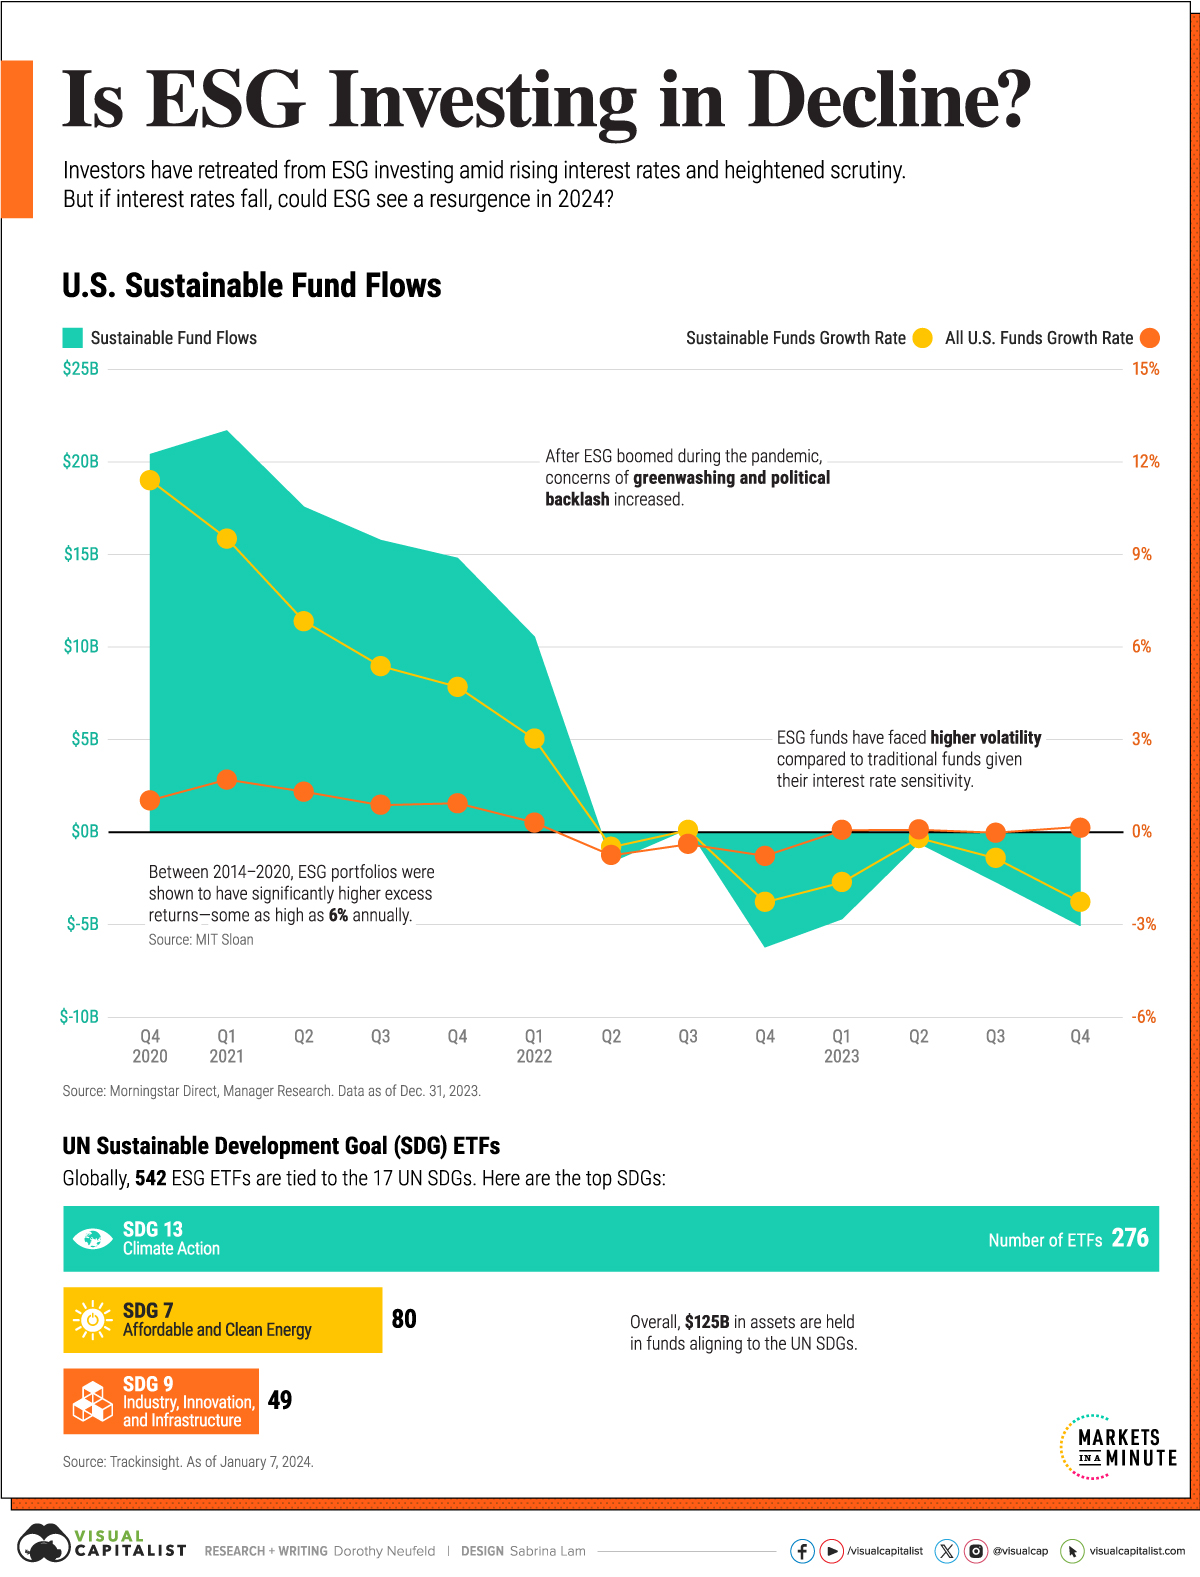
Is ESG Investing in Decline?
This was originally posted on Advisor Channel. Sign up to the free mailing list to get beautiful visualizations on financial markets that help advisors and their clients.
These days, ESG investments have lost their luster given high interest rates, political backlash, and greenwashing scrutiny.
In 2021 during the pandemic boom, U.S. sustainable funds hit a record $358 billion in assets, up from $95 billion in 2017. But since then, investor interest has waned as higher borrowing costs impact capital-intensive clean tech stocks.
This graphic shows the drop in sustainable fund flows—often considered an indicator of investor sentiment—based on data from Morningstar.
Slowing Demand
In 2023, investor appetite cooled for sustainable investments, as fund flows notched their worst year on record.
Overall, flows sank $13 billion as fund performance lagged behind conventional funds. Adding to this, concerns surrounding the murkiness of environmental, social, and governance (ESG) ratings were put under the spotlight.
As ESG pushback intensified in U.S. politics, at least 165 anti-ESG bills were introduced in 2023. Politicians have claimed that ESG criteria negatively impacts financial returns, but evidence behind that is mixed.
While sustainable funds underperformed traditional funds in 2023, a separate study showed that ESG portfolios had as much as 6% excess returns annually compared to benchmark indexes between 2014 and 2020.
ESG Investments: A Closer Look
One key aspect of ESG funds is whether they hold investments that align with the UN Sustainable Development Goals (SDGs).
Globally, 542 funds with $125 billion in assets are associated with at least one of these objectives. The table below shows the top five SDGs, by ETF assets under management (AUM).
| SDG | Goal | Number of ETFs | AUM |
|---|---|---|---|
| SDG 13 | Climate Action | 275 | $65.4B |
| SDG 7 | Affordable and Clean Energy | 80 | $15.3B |
| SDG 9 | Industry, Innovation, and Infrastructure | 49 | $13.4B |
| SDG 6 | Clean Water and Sanitation | 16 | $9.1B |
| SDG 11 | Sustainable Cities and Communities | 34 | $5.5B |
Source: Trackinsight. As of January 7, 2024.
We can see that Climate Action is the highest overall, with companies held in these ETFs making commitments to lower emissions and advance sustainability.
For instance, Home Depot has cut electricity use by over 50% since 2010 in U.S. stores, and aims to use renewables for all of its electricity by 2030. In addition, Microsoft has committed to this goal through a number of initiatives, including providing access to clean water to over one million people across Indonesia, Brazil, India, and Mexico in 2023.
While investor interest has slowed, 35% of advisors said they used ESG funds last year, based on a Journal of Financial Planning survey. As the industry matures, it remains to be seen if ESG investments will see a resurgence, especially if interest rates fall in the coming years.


Green
The Carbon Footprint of Major Travel Methods
Going on a cruise ship and flying domestically are the most carbon-intensive travel methods.


The Carbon Footprint of Major Travel Methods
This was originally posted on our Voronoi app. Download the app for free on iOS or Android and discover incredible data-driven charts from a variety of trusted sources.
Did you know that transport accounts for nearly one-quarter of global energy-related carbon dioxide (CO₂) emissions?
This graphic illustrates the carbon footprints of major travel methods measured in grams of carbon dioxide equivalent (CO₂e) emitted per person to travel one kilometer. This includes both CO₂ and other greenhouse gases.
Data is sourced from Our World in Data, the UK Government’s Department for Energy Security and Net Zero, and The International Council on Clean Transportation, as of December 2022.
These figures should be interpreted as approximations, rather than exact numbers. There are many variables at play that determine the actual carbon footprint in any individual case, including vehicle type or model, occupancy, energy mix, and even weather.
Cruise Ships are the Most Carbon-Intensive Travel Method
According to these estimates, taking a cruise ship, flying domestically, and driving alone are some of the most carbon-intensive travel methods.
Cruise ships typically use heavy fuel oil, which is high in carbon content. The average cruise ship weighs between 70,000 to 180,000 metric tons, meaning they require large engines to get moving.
These massive vessels must also generate power for onboard amenities such as lighting, air conditioning, and entertainment systems.
Short-haul flights are also considered carbon-intensive due to the significant amount of fuel consumed during initial takeoff and climbing altitude, relative to a lower amount of cruising.
| Transportation method | CO₂ equivalent emissions per passenger km |
|---|---|
| Cruise Ship | 250 |
| Short-haul flight (i.e. within a U.S. state or European country) | 246 |
| Diesel car | 171 |
| Gas car | 170 |
| Medium-haul flight (i.e. international travel within Europe, or between U.S. states) | 151 |
| Long-haul flight (over 3,700 km, about the distance from LA to NY) | 147 |
| Motorbike | 113 |
| Bus (average) | 96 |
| Plug-in hybrid | 68 |
| Electric car | 47 |
| National rail | 35 |
| Tram | 28 |
| London Underground | 27 |
| Ferry (foot passenger) | 19 |
| Eurostar (International rail) | 4.5 |
Are EVs Greener?
Many experts agree that EVs produce a lower carbon footprint over time versus traditional internal combustion engine (ICE) vehicles.
However, the batteries in electric vehicles charge on the power that comes straight off the electrical grid—which in many places may be powered by fossil fuels. For that reason, the carbon footprint of an EV will depend largely on the blend of electricity sources used for charging.
There are also questions about how energy-intensive it is to build EVs compared to a comparable ICE vehicle.

-

 Education1 week ago
How Hard Is It to Get Into an Ivy League School?
-

 Technology2 weeks ago
Ranked: Semiconductor Companies by Industry Revenue Share
-

 Markets2 weeks ago
Ranked: The World’s Top Flight Routes, by Revenue
-

 Demographics2 weeks ago
Population Projections: The World’s 6 Largest Countries in 2075
-

 Markets2 weeks ago
The Top 10 States by Real GDP Growth in 2023
-

 Demographics2 weeks ago
The Smallest Gender Wage Gaps in OECD Countries
-

 Economy2 weeks ago
Where U.S. Inflation Hit the Hardest in March 2024
-

 Green2 weeks ago
Top Countries By Forest Growth Since 2001