Markets
Visualizing Major U.S. Banks by Commercial Real Estate Exposure
![]() See this visualization first on the Voronoi app.
See this visualization first on the Voronoi app.
U.S. Banks by Commercial Real Estate Exposure
This was originally posted on our Voronoi app. Download the app for free on iOS or Android and discover incredible data-driven charts from a variety of trusted sources.
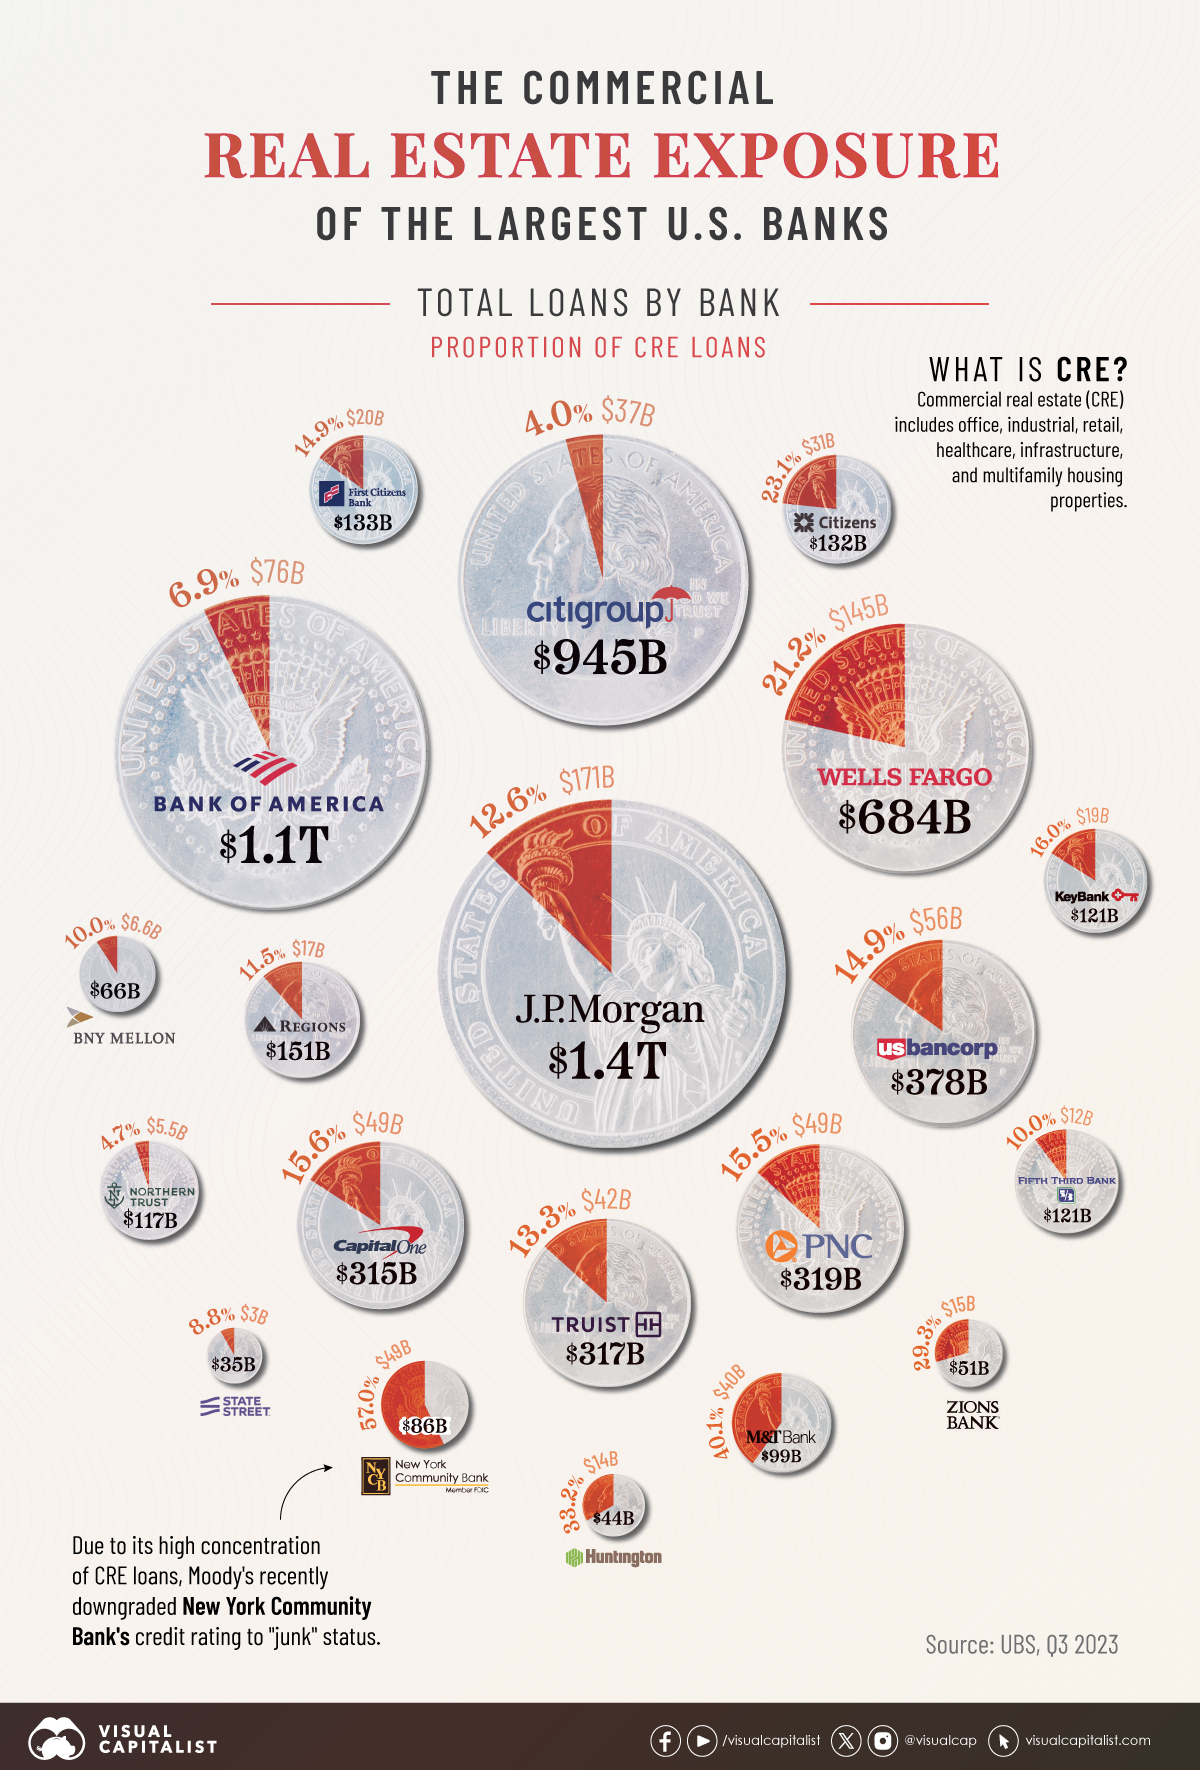
The six largest U.S. banks saw delinquent commercial property loans nearly triple to $9.3 billion in 2023 amid high vacancy rates and increasing borrowing costs.
Today, the sector is facing greater scrutiny from regulators amid growing risks to bank stability. In fact, for almost half of all U.S. banks, commercial real estate debt is the largest loan category overall. While commercial loans are more heavily concentrated in small U.S. banks, several major financial institutions have amassed significant commercial loan portfolios.
The above graphic shows the commercial real estate exposure of the top U.S. banks, based on data from UBS as of Q3 2023.
Top 20 U.S. Banks by Assets: Commercial Property Exposure
Here are the commercial property loans across the largest U.S. banks by assets as of the third quarter of 2023:
| Bank | Total Assets | Total Loans and Leases | Total Commercial Real Estate Loans | Share of Total Loans |
|---|---|---|---|---|
| JPMorgan Chase & Co. | $3.9T | $1.4T | $171B | 12.6% |
| Bank of America Corp | $3.2T | $1.1T | $76B | 6.9% |
| Citigroup Inc. | $2.2T | $945B | $37B | 4.0% |
| Wells Fargo & Company | $1.9T | $684B | $145B | 21.2% |
| U.S. Bancorp | $668B | $378B | $56B | 14.9% |
| PNC Financial Services Group, Inc. | $557B | $319B | $49B | 15.5% |
| Truist Financial Corporation | $543B | $317B | $42B | 13.3% |
| Capital One Financial Corp | $471B | $316B | $49B | 15.6% |
| Bank of New York Mellon Corp | $405B | $66B | $7B | 10.0% |
| State Street Corporation | $284B | $35B | $3B | 8.8% |
| Citizens Financial Group, Inc. | $226B | $132B | $31B | 23.1% |
| First Citizens BancShares, Inc. | $214B | $133B | $20B | 14.9% |
| Fifth Third Bancorp | $213B | $121B | $12B | 10.0% |
| M&T Bank Corporation | $209B | $99B | $40B | 40.1% |
| Keycorp | $188B | $121B | $19B | 16.0% |
| Huntington Bancshares Incorporated | $187B | $44B | $14B | 33.2% |
| Regions Financial Corporation | $154B | $151B | $17B | 11.5% |
| Northern Trust Corporation | $146B | $117B | $6B | 4.7% |
| New York Community Bancorp Inc | $111B | $86B | $49B | 57.0% |
| Zions Bancorporation, N.A. | $87B | $51B | $15B | 29.3% |
As the above table shows, JPMorgan Chase, America’s largest bank, has 12.6% of its loan portfolio in commercial real estate.
Despite commercial property troubles, the company witnessed record stock prices in 2023, with its share price increasing 27% over the year. The bank acquired First Republic at the height of the U.S. regional banking turmoil in 2023, which helped boost performance.
Still, big banks remain cautious. Several major banks, such as Wells Fargo, are building bigger cash reserves for commercial property credit losses as a buffer for potential defaults.
Perhaps the most concerning big bank is New York Community Bancorp, which has 57% of its total loans exposed to commercial property debt. The bank reported a $2.7 billion loss in the fourth quarter of 2023, and Moody’s recently downgraded its credit rating to “junk” status. The bank brought in a $1 billion infusion of capital as a lifeline after growing concerns about the state of its commercial real estate loan portfolio.
Overall, while pockets of trouble are surfacing, major banks are more insulated from commercial property shocks compared to other banks. On average, about 11% of big banks loan portfolios are concentrated in commercial real estate compared to small banks, where average exposure falls around 21.6% of loans.


Markets
The European Stock Market: Attractive Valuations Offer Opportunities
On average, the European stock market has valuations that are nearly 50% lower than U.S. valuations. But how can you access the market?


European Stock Market: Attractive Valuations Offer Opportunities
Europe is known for some established brands, from L’Oréal to Louis Vuitton. However, the European stock market offers additional opportunities that may be lesser known.
The above infographic, sponsored by STOXX, outlines why investors may want to consider European stocks.
Attractive Valuations
Compared to most North American and Asian markets, European stocks offer lower or comparable valuations.
| Index | Price-to-Earnings Ratio | Price-to-Book Ratio |
|---|---|---|
| EURO STOXX 50 | 14.9 | 2.2 |
| STOXX Europe 600 | 14.4 | 2 |
| U.S. | 25.9 | 4.7 |
| Canada | 16.1 | 1.8 |
| Japan | 15.4 | 1.6 |
| Asia Pacific ex. China | 17.1 | 1.8 |
Data as of February 29, 2024. See graphic for full index names. Ratios based on trailing 12 month financials. The price to earnings ratio excludes companies with negative earnings.
On average, European valuations are nearly 50% lower than U.S. valuations, potentially offering an affordable entry point for investors.
Research also shows that lower price ratios have historically led to higher long-term returns.
Market Movements Not Closely Connected
Over the last decade, the European stock market had low-to-moderate correlation with North American and Asian equities.
The below chart shows correlations from February 2014 to February 2024. A value closer to zero indicates low correlation, while a value of one would indicate that two regions are moving in perfect unison.
| EURO STOXX 50 | STOXX EUROPE 600 | U.S. | Canada | Japan | Asia Pacific ex. China |
|
|---|---|---|---|---|---|---|
| EURO STOXX 50 | 1.00 | 0.97 | 0.55 | 0.67 | 0.24 | 0.43 |
| STOXX EUROPE 600 | 1.00 | 0.56 | 0.71 | 0.28 | 0.48 | |
| U.S. | 1.00 | 0.73 | 0.12 | 0.25 | ||
| Canada | 1.00 | 0.22 | 0.40 | |||
| Japan | 1.00 | 0.88 | ||||
| Asia Pacific ex. China | 1.00 |
Data is based on daily USD returns.
European equities had relatively independent market movements from North American and Asian markets. One contributing factor could be the differing sector weights in each market. For instance, technology makes up a quarter of the U.S. market, but health care and industrials dominate the broader European market.
Ultimately, European equities can enhance portfolio diversification and have the potential to mitigate risk for investors.
Tracking the Market
For investors interested in European equities, STOXX offers a variety of flagship indices:
| Index | Description | Market Cap |
|---|---|---|
| STOXX Europe 600 | Pan-regional, broad market | €10.5T |
| STOXX Developed Europe | Pan-regional, broad-market | €9.9T |
| STOXX Europe 600 ESG-X | Pan-regional, broad market, sustainability focus | €9.7T |
| STOXX Europe 50 | Pan-regional, blue-chip | €5.1T |
| EURO STOXX 50 | Eurozone, blue-chip | €3.5T |
Data is as of February 29, 2024. Market cap is free float, which represents the shares that are readily available for public trading on stock exchanges.
The EURO STOXX 50 tracks the Eurozone’s biggest and most traded companies. It also underlies one of the world’s largest ranges of ETFs and mutual funds. As of November 2023, there were €27.3 billion in ETFs and €23.5B in mutual fund assets under management tracking the index.
“For the past 25 years, the EURO STOXX 50 has served as an accurate, reliable and tradable representation of the Eurozone equity market.”
— Axel Lomholt, General Manager at STOXX
Partnering with STOXX to Track the European Stock Market
Are you interested in European equities? STOXX can be a valuable partner:
- Comprehensive, liquid and investable ecosystem
- European heritage, global reach
- Highly sophisticated customization capabilities
- Open architecture approach to using data
- Close partnerships with clients
- Part of ISS STOXX and Deutsche Börse Group
With a full suite of indices, STOXX can help you benchmark against the European stock market.
Learn how STOXX’s European indices offer liquid and effective market access.

-

 Economy2 days ago
Economic Growth Forecasts for G7 and BRICS Countries in 2024
The IMF has released its economic growth forecasts for 2024. How do the G7 and BRICS countries compare?
-

 Markets1 week ago
U.S. Debt Interest Payments Reach $1 Trillion
U.S. debt interest payments have surged past the $1 trillion dollar mark, amid high interest rates and an ever-expanding debt burden.
-

 United States2 weeks ago
Ranked: The Largest U.S. Corporations by Number of Employees
We visualized the top U.S. companies by employees, revealing the massive scale of retailers like Walmart, Target, and Home Depot.
-

 Markets2 weeks ago
The Top 10 States by Real GDP Growth in 2023
This graphic shows the states with the highest real GDP growth rate in 2023, largely propelled by the oil and gas boom.
-

 Markets2 weeks ago
Ranked: The World’s Top Flight Routes, by Revenue
In this graphic, we show the highest earning flight routes globally as air travel continued to rebound in 2023.
-

 Markets2 weeks ago
Ranked: The Most Valuable Housing Markets in America
The U.S. residential real estate market is worth a staggering $47.5 trillion. Here are the most valuable housing markets in the country.


-

 Education1 week ago
How Hard Is It to Get Into an Ivy League School?
-

 Technology2 weeks ago
Ranked: Semiconductor Companies by Industry Revenue Share
-
Markets2 weeks ago
Ranked: The World’s Top Flight Routes, by Revenue
-

 Demographics2 weeks ago
Population Projections: The World’s 6 Largest Countries in 2075
-
Markets2 weeks ago
The Top 10 States by Real GDP Growth in 2023
-

 Demographics2 weeks ago
The Smallest Gender Wage Gaps in OECD Countries
-

 Economy2 weeks ago
Where U.S. Inflation Hit the Hardest in March 2024
-

 Environment2 weeks ago
Top Countries By Forest Growth Since 2001