Markets
Ranked: The U.S. Cities with the Most Vacant Offices


Ranked: The U.S. Cities with the Most Vacant Offices
For many across the U.S., hour-long transit rides and traffic jams to work have been replaced by roll-out-of-bed commutes and stand-up desks at home, leaving vacant offices behind.
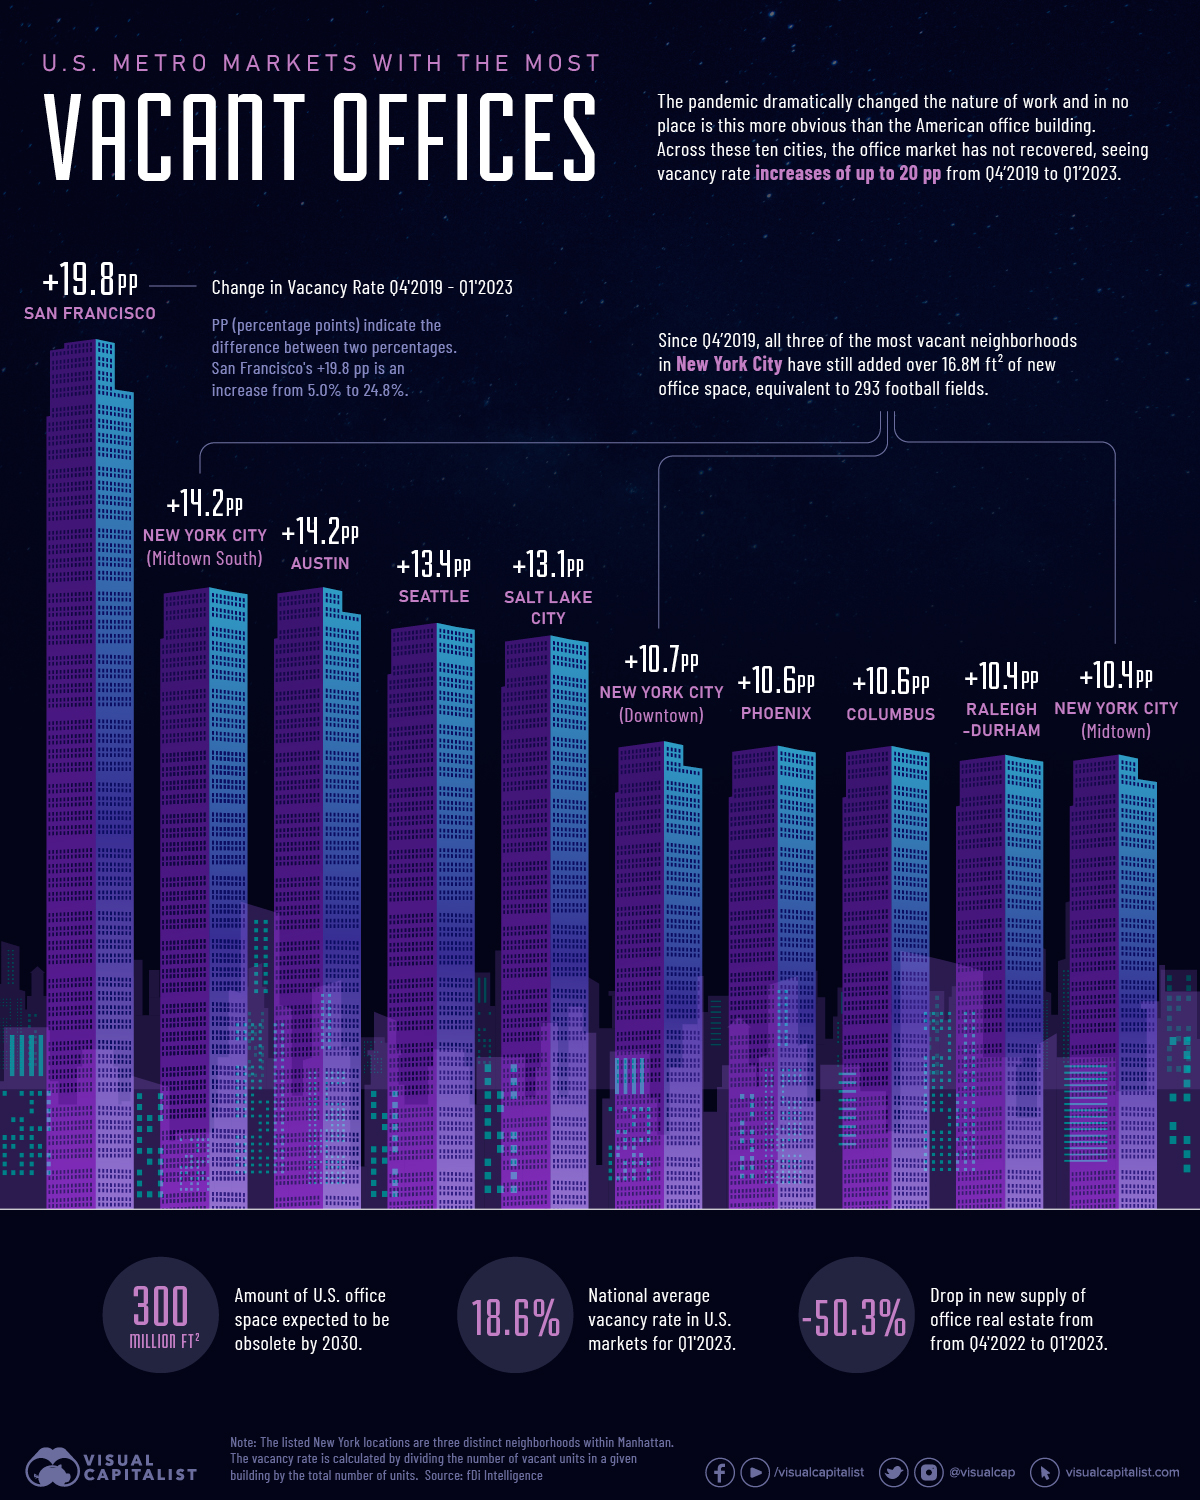
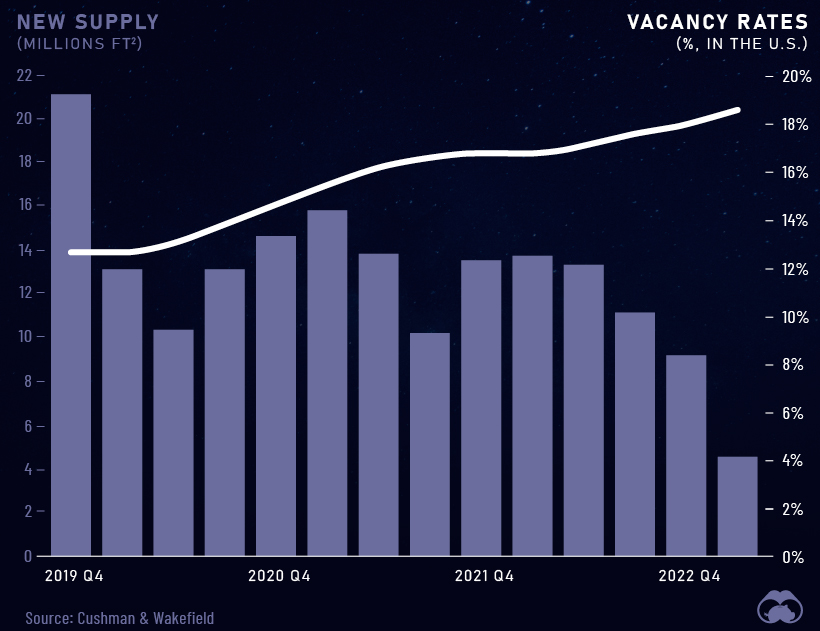
Long story short, more and more offices in major U.S. cities are empty. At the end of March 2023, the national average vacancy rate of U.S. offices had climbed as high as 18.6%.
So how have different cities in the U.S. been impacted? This ranking uses data out of fDi Intelligence to rank the top 10 cities that have seen the biggest increases in office vacancy rates from Q4’2019 to Q1’2023.
No Vacancy
It is anticipated that by 2030, over 300 million square feet of U.S. office spaces will be obsolete.
According to Pew Research Center, around 35% of U.S. workers who can work from home in 2023 are already doing so all the time. In short, unless trends begin to reverse, offices in many cities will stay empty or continue getting emptier.
Here’s a closer look at the cities with the fastest growing vacancy rates in percentage points (p.p.) terms since just before the COVID-19 pandemic:
| Rank | City | State | Change in Vacancy Rates Q4'2019 vs. Q1'2023 |
|---|---|---|---|
| #1 | San Francisco | California | +19.8 p.p. |
| #2 | New York City (Midtown South) | New York | +14.2 p.p. |
| #3 | Austin | Texas | +14.2 p.p. |
| #4 | Seattle | Washington | +13.4 p.p. |
| #5 | Salt Lake City | Utah | +13.1 p.p. |
| #6 | New York City (Downtown) | New York | +10.7 p.p. |
| #7 | Phoenix | Arizona | +10.6 p.p. |
| #8 | Columbus | Ohio | +10.6 p.p. |
| #9 | Raleigh-Durham | North Carolina | +10.4 p.p. |
| #10 | New York City (Midtown) | New York | +10.4 p.p. |
San Francisco has been hardest hit, with vacancy rates climbing by 19.8 p.p. in just over three years. Meanwhile, New York City has added over 16.8 million square feet, equivalent to 293 football fields, of new office space since Q4’2019 between its three most vacant neighborhoods.
However, not all of the cities with the most vacant offices are huge metropolises. Urban areas like Austin, Columbus, and Raleigh-Durham have also seen massive increases in their office vacancies, but their increasing rates may be blamed more on new construction and oversupply than to falling demand.
The Office Real Estate Market
At the national level, the supply of new office real estate has been dropping steadily since Q1’2022, down by a whopping 67% year-over-year.
Overall, it looks like U.S. office buildings are not as bustling as they once were, but there still may be opportunities for the office real estate market in growing cities.


Markets
The European Stock Market: Attractive Valuations Offer Opportunities
On average, the European stock market has valuations that are nearly 50% lower than U.S. valuations. But how can you access the market?


European Stock Market: Attractive Valuations Offer Opportunities
Europe is known for some established brands, from L’Oréal to Louis Vuitton. However, the European stock market offers additional opportunities that may be lesser known.
The above infographic, sponsored by STOXX, outlines why investors may want to consider European stocks.
Attractive Valuations
Compared to most North American and Asian markets, European stocks offer lower or comparable valuations.
| Index | Price-to-Earnings Ratio | Price-to-Book Ratio |
|---|---|---|
| EURO STOXX 50 | 14.9 | 2.2 |
| STOXX Europe 600 | 14.4 | 2 |
| U.S. | 25.9 | 4.7 |
| Canada | 16.1 | 1.8 |
| Japan | 15.4 | 1.6 |
| Asia Pacific ex. China | 17.1 | 1.8 |
Data as of February 29, 2024. See graphic for full index names. Ratios based on trailing 12 month financials. The price to earnings ratio excludes companies with negative earnings.
On average, European valuations are nearly 50% lower than U.S. valuations, potentially offering an affordable entry point for investors.
Research also shows that lower price ratios have historically led to higher long-term returns.
Market Movements Not Closely Connected
Over the last decade, the European stock market had low-to-moderate correlation with North American and Asian equities.
The below chart shows correlations from February 2014 to February 2024. A value closer to zero indicates low correlation, while a value of one would indicate that two regions are moving in perfect unison.
| EURO STOXX 50 | STOXX EUROPE 600 | U.S. | Canada | Japan | Asia Pacific ex. China |
|
|---|---|---|---|---|---|---|
| EURO STOXX 50 | 1.00 | 0.97 | 0.55 | 0.67 | 0.24 | 0.43 |
| STOXX EUROPE 600 | 1.00 | 0.56 | 0.71 | 0.28 | 0.48 | |
| U.S. | 1.00 | 0.73 | 0.12 | 0.25 | ||
| Canada | 1.00 | 0.22 | 0.40 | |||
| Japan | 1.00 | 0.88 | ||||
| Asia Pacific ex. China | 1.00 |
Data is based on daily USD returns.
European equities had relatively independent market movements from North American and Asian markets. One contributing factor could be the differing sector weights in each market. For instance, technology makes up a quarter of the U.S. market, but health care and industrials dominate the broader European market.
Ultimately, European equities can enhance portfolio diversification and have the potential to mitigate risk for investors.
Tracking the Market
For investors interested in European equities, STOXX offers a variety of flagship indices:
| Index | Description | Market Cap |
|---|---|---|
| STOXX Europe 600 | Pan-regional, broad market | €10.5T |
| STOXX Developed Europe | Pan-regional, broad-market | €9.9T |
| STOXX Europe 600 ESG-X | Pan-regional, broad market, sustainability focus | €9.7T |
| STOXX Europe 50 | Pan-regional, blue-chip | €5.1T |
| EURO STOXX 50 | Eurozone, blue-chip | €3.5T |
Data is as of February 29, 2024. Market cap is free float, which represents the shares that are readily available for public trading on stock exchanges.
The EURO STOXX 50 tracks the Eurozone’s biggest and most traded companies. It also underlies one of the world’s largest ranges of ETFs and mutual funds. As of November 2023, there were €27.3 billion in ETFs and €23.5B in mutual fund assets under management tracking the index.
“For the past 25 years, the EURO STOXX 50 has served as an accurate, reliable and tradable representation of the Eurozone equity market.”
— Axel Lomholt, General Manager at STOXX
Partnering with STOXX to Track the European Stock Market
Are you interested in European equities? STOXX can be a valuable partner:
- Comprehensive, liquid and investable ecosystem
- European heritage, global reach
- Highly sophisticated customization capabilities
- Open architecture approach to using data
- Close partnerships with clients
- Part of ISS STOXX and Deutsche Börse Group
With a full suite of indices, STOXX can help you benchmark against the European stock market.
Learn how STOXX’s European indices offer liquid and effective market access.

-

 Economy3 days ago
Economic Growth Forecasts for G7 and BRICS Countries in 2024
The IMF has released its economic growth forecasts for 2024. How do the G7 and BRICS countries compare?
-

 Markets2 weeks ago
U.S. Debt Interest Payments Reach $1 Trillion
U.S. debt interest payments have surged past the $1 trillion dollar mark, amid high interest rates and an ever-expanding debt burden.
-

 United States2 weeks ago
Ranked: The Largest U.S. Corporations by Number of Employees
We visualized the top U.S. companies by employees, revealing the massive scale of retailers like Walmart, Target, and Home Depot.
-

 Markets2 weeks ago
The Top 10 States by Real GDP Growth in 2023
This graphic shows the states with the highest real GDP growth rate in 2023, largely propelled by the oil and gas boom.
-

 Markets3 weeks ago
Ranked: The World’s Top Flight Routes, by Revenue
In this graphic, we show the highest earning flight routes globally as air travel continued to rebound in 2023.
-

 Markets3 weeks ago
Ranked: The Most Valuable Housing Markets in America
The U.S. residential real estate market is worth a staggering $47.5 trillion. Here are the most valuable housing markets in the country.

-

 Science1 week ago
Visualizing the Average Lifespans of Mammals
-
Markets2 weeks ago
The Top 10 States by Real GDP Growth in 2023
-

 Demographics2 weeks ago
The Smallest Gender Wage Gaps in OECD Countries
-

 United States2 weeks ago
Where U.S. Inflation Hit the Hardest in March 2024
-

 Green2 weeks ago
Top Countries By Forest Growth Since 2001
-
United States2 weeks ago
Ranked: The Largest U.S. Corporations by Number of Employees
-

 Maps2 weeks ago
The Largest Earthquakes in the New York Area (1970-2024)
-

 Green2 weeks ago
Ranked: The Countries With the Most Air Pollution in 2023