Markets
Visualizing 1 Billion Square Feet of Empty Office Space
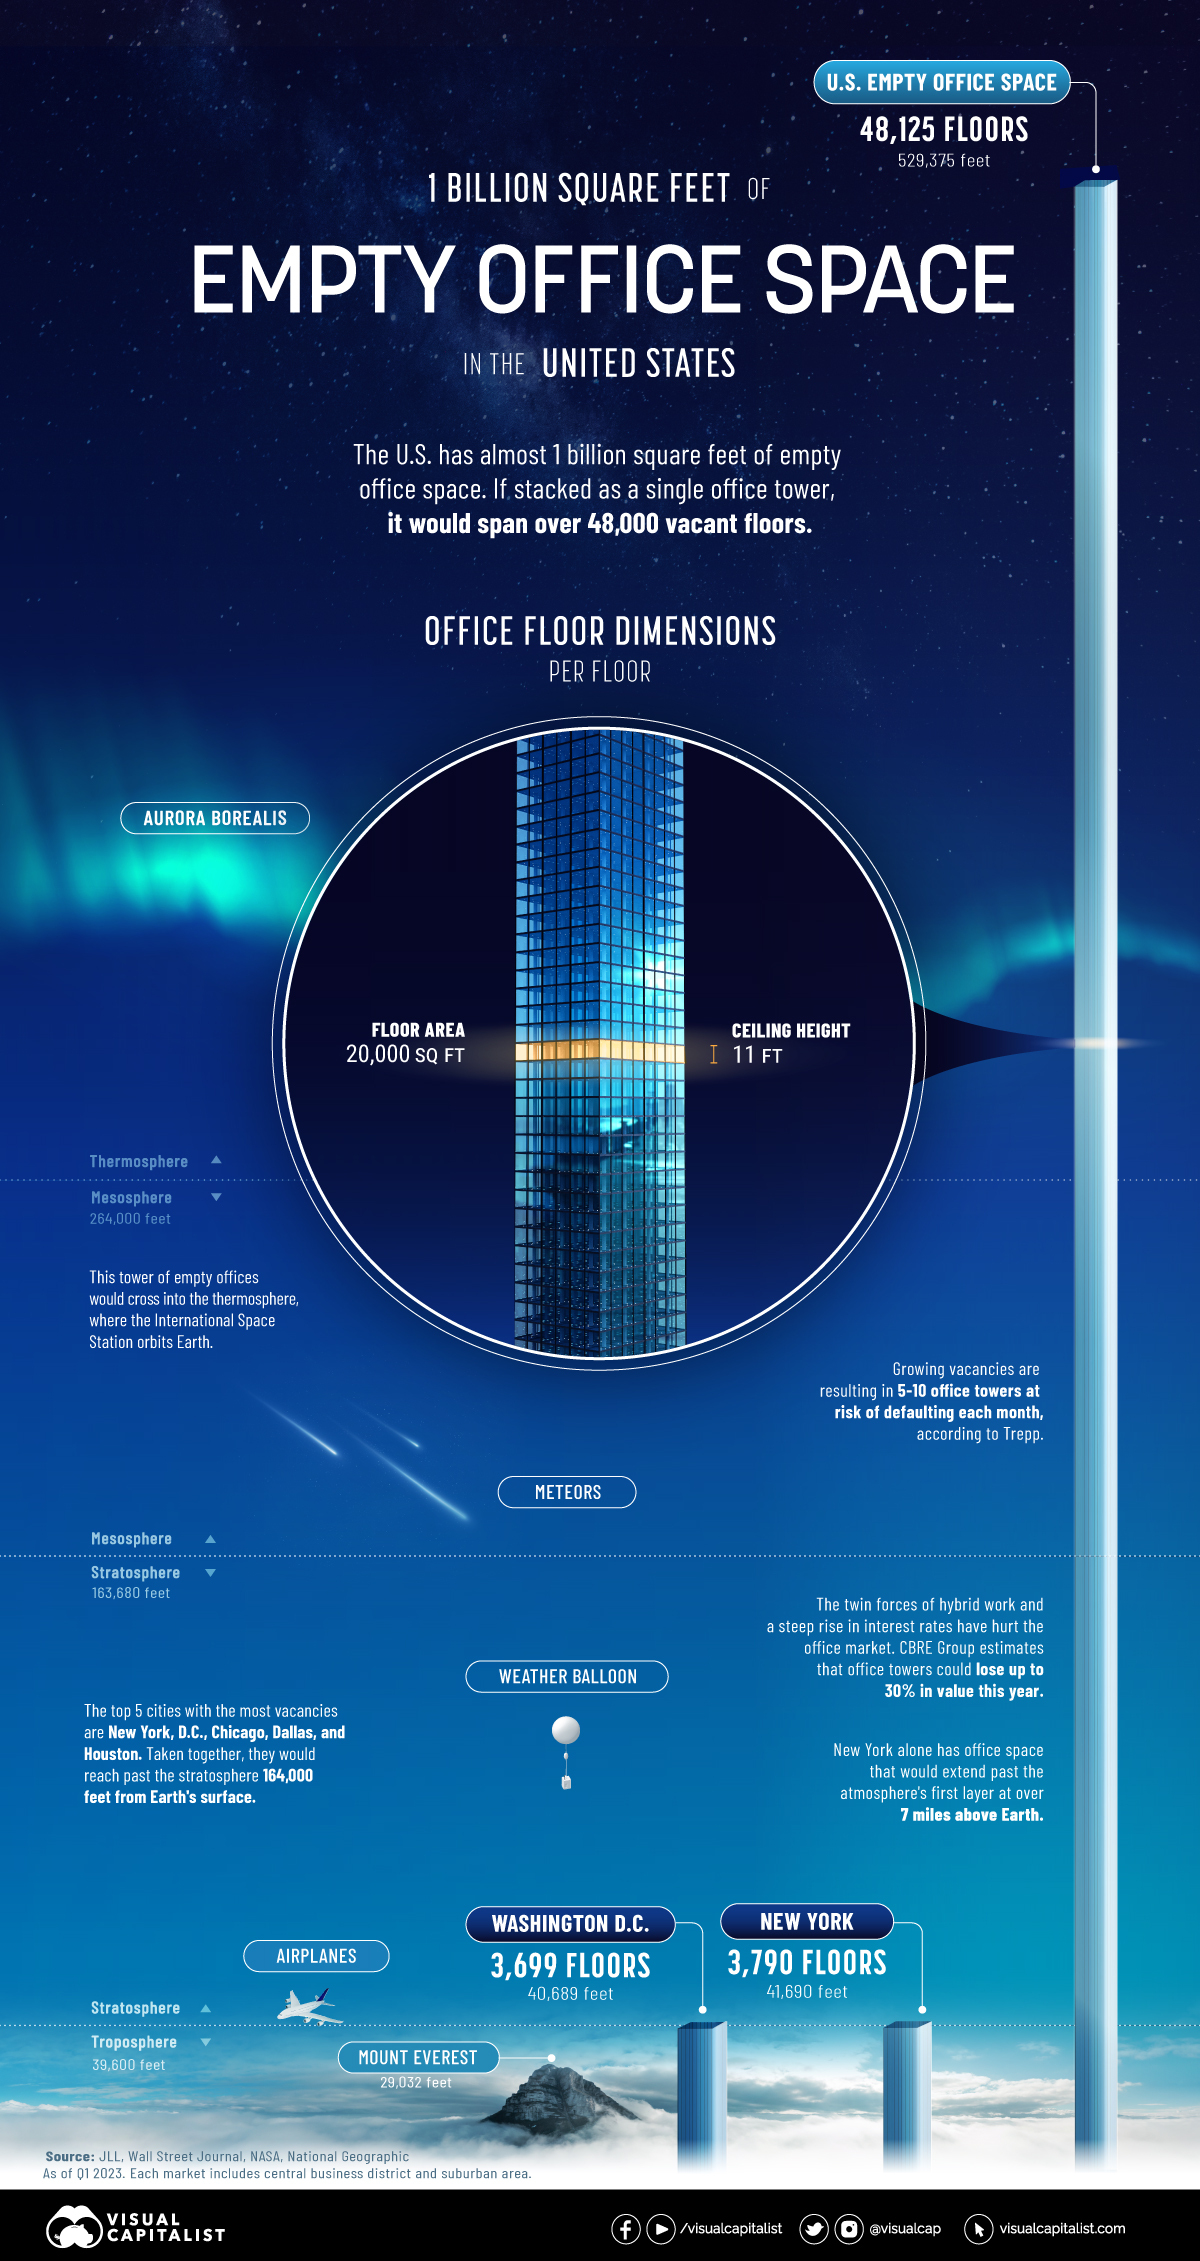


1 Billion Square Feet of Empty Office Space
In April, one of America’s largest office owners, Brookfield, defaulted on a $161 million loan.
The loan, covering 12 office buildings, was mainly concentrated in the Washington, D.C. market. Faced with low occupancy rates, it joined other office giants Blackstone and WeWork defaulting on office debt this year.
The above graphic shows nearly 1 billion square feet of empty office space in the U.S. based on data from JLL—and the wider implications of office towers standing empty.
Ranking U.S. Cities by Empty Office Space
At the end of the first quarter of 2023, a record 963 million square feet of office space was unoccupied in America. An estimated five to 10 office towers are at risk of defaulting each month according to Manus Clancy, senior managing director at Trepp.
Here are cities ranked by their total square feet of office vacancy as of Q1 2023. Figures include central business districts and suburban areas.
| Ranking | Market | Total Vacancy (SF) | Total Vacancy (%) |
|---|---|---|---|
| 1 | New York | 75.8M | 16.1% |
| 2 | Washington, D.C. | 74.0M | 20.8% |
| 3 | Chicago | 63.2M | 23.5% |
| 4 | Dallas | 53.5M | 25.0% |
| 5 | Houston | 49.3M | 25.6% |
| 6 | Los Angeles | 47.1M | 24.1% |
| 7 | New Jersey | 43.3M | 25.8% |
| 8 | Atlanta | 38.1M | 21.6% |
| 9 | Boston | 31.8M | 19.1% |
| 10 | Philadelphia | 27.8M | 18.8% |
| 11 | Denver | 27.3M | 21.6% |
| 12 | Phoenix | 25.2M | 23.9% |
| 13 | San Francisco | 22.8M | 26.4% |
| 14 | Seattle | 21.4M | 17.7% |
| 15 | Minneapolis | 19.9M | 19.7% |
| 16 | Detroit | 18.0M | 19.3% |
| 17 | Orange County | 17.7M | 17.6% |
| 18 | Salt Lake City | 13.9M | 18.5% |
| 19 | Kansas City | 13.8M | 20.8% |
| 20 | Pittsburgh | 13.8M | 21.8% |
| 21 | Charlotte | 13.7M | 20.6% |
| 22 | Austin | 13.6M | 18.9% |
| 23 | Baltimore | 13.1M | 18.2% |
| 24 | Portland | 12.8M | 17.5% |
| 25 | Silicon Valley | 12.1M | 17.3% |
| 26 | Oakland–East Bay | 11.7M | 22.0% |
| 27 | San Diego | 10.7M | 12.3% |
| 28 | St. Louis | 10.5M | 21.9% |
| 29 | Cincinnati | 10.1M | 21.4% |
| 30 | Sacramento | 9.9M | 19.6% |
| 31 | Fairfield County | 9.7M | 25.4% |
| 32 | Columbus | 9.7M | 21.7% |
| 33 | Milwaukee | 9.2M | 24.0% |
| 34 | Nashville | 9.0M | 18.9% |
| 35 | Raleigh-Durham | 8.9M | 15.2% |
| 36 | Indianapolis | 8.6M | 22.4% |
| 37 | Tampa | 8.2M | 17.2% |
| 38 | Fort Worth | 7.6M | 16.7% |
| 39 | Miami | 7.6M | 16.2% |
| 40 | Cleveland | 7.3M | 18.3% |
| 41 | San Antonio | 7.2M | 17.8% |
| 42 | Long Island | 6.3M | 15.2% |
| 43 | Westchester County | 5.8M | 22.1% |
| 44 | Jacksonville | 5.4M | 18.6% |
| 45 | Orlando | 5.0M | 13.3% |
| 46 | San Francisco Peninsula | 4.4M | 13.3% |
| 47 | Richmond | 4.3M | 13.3% |
| 48 | Fort Lauderdale | 4.3M | 16.1% |
| 49 | North San Francisco Bay | 4.0M | 18.3% |
| 50 | Louisville | 3.6M | 16.8% |
| 51 | Des Moines | 3.2M | 12.0% |
| 52 | Hampton Roads | 3.1M | 14.7% |
| 53 | West Palm Beach | 2.4M | 10.3% |
| 54 | Grand Rapids | 1.8M | 13.2% |
| United States | 962.5M | 20.2% |
Numbers may not total 100 due to rounding.
New York has roughly 76 million square feet of empty office space. If this were stacked as a single office building, it would stretch 7 miles into the atmosphere. In 2019, the office sector accounted for about a third of all jobs in the city.
Falling closely behind is Washington, D.C. with a 21% vacancy rate—8% higher than what is typically considered healthy. Occupiers are downsizing given remote work trends, yet some office buildings are being converted to residential properties, curtailing vacancy rates.
Across 54 markets in the dataset, San Francisco has the highest vacancy rate at over 26%. Prior to the pandemic, vacancy rates were about 4%. This year, Salesforce walked away from a 30-story tower in downtown San Francisco spanning 104,000 square feet in an effort to cut costs.
Overall, rising interest rates and higher vacancies have hurt U.S. office markets, with many cities potentially seeing an uptick in vacancies going forward.
Empty Office Space: Impact on Banks
Office building valuations are projected to fall 30% in 2023 according to Richard Barkham, global chief economist at CBRE Group.
A sharp decline in property values could potentially result in steep losses for banks. This is especially true for small and regional banks that make up the majority of U.S. office loans. Big banks cover roughly 20% of office and downtown retail totals.
Consider how commercial real estate exposure breaks down by different types of banks:
| Bank Assets | Commercial Real Estate Loans % of Total Assets | Share of Industry Assets |
|---|---|---|
| <$100M | 11.3% | 0.2% |
| $100M-$1B | 26.9% | 4.7% |
| $1B-$10B | 32.5% | 9.7% |
| $10B-$250B | 18.1% | 30.1% |
| >$250B | 5.6% | 55.5% |
Source: FitchRatings
For big banks, a recent stress test by the Federal Reserve shows that a 40% decline in commercial property values could result in a $65 billion loss on their commercial loan portfolios. The good news is that many big banks are sitting on healthy capital reserves based on requirements set in place after the global financial crisis.
Smaller banks are a different story. Many have higher loan concentrations and less oversight on reserve requirements. If these loan portfolios deteriorate, banks may face a downgrade in ratings and higher credit losses.
Additionally, banks with loans in markets with high vacancy rates like San Francisco, Houston, and Washington, D.C. could see more elevated risk.
How High Rates Could Escalate Losses
Adding further strain are the ramifications of higher interest rates.
Higher rates have negatively impacted smaller banks’ balance sheets—meaning they are less likely to issue new loans. This is projected to cause commercial real estate transaction volume to decline 27% in 2023, contributing to lower prices. Banks have already slowed lending for commercial real estate in 2023 due to credit quality concerns.
The good news is that some banks are extending existing loan terms or restructuring debt. In this way, banks are willing to negotiate new loan agreements to prevent widespread foreclosures from hurting their commercial loan portfolios. Short-term extensions on existing loans were often seen during the global financial crisis.
Still, foreclosures could take place if restructuring the loan doesn’t make financial sense.
Overall, only so many banks may be willing to wait out the uncertainty with loan extensions if fundamentals continue to worsen. Offices that are positioned to weather declines will likely have better quality, location, roster of tenants, and financing structures.


Markets
The European Stock Market: Attractive Valuations Offer Opportunities
On average, the European stock market has valuations that are nearly 50% lower than U.S. valuations. But how can you access the market?


European Stock Market: Attractive Valuations Offer Opportunities
Europe is known for some established brands, from L’Oréal to Louis Vuitton. However, the European stock market offers additional opportunities that may be lesser known.
The above infographic, sponsored by STOXX, outlines why investors may want to consider European stocks.
Attractive Valuations
Compared to most North American and Asian markets, European stocks offer lower or comparable valuations.
| Index | Price-to-Earnings Ratio | Price-to-Book Ratio |
|---|---|---|
| EURO STOXX 50 | 14.9 | 2.2 |
| STOXX Europe 600 | 14.4 | 2 |
| U.S. | 25.9 | 4.7 |
| Canada | 16.1 | 1.8 |
| Japan | 15.4 | 1.6 |
| Asia Pacific ex. China | 17.1 | 1.8 |
Data as of February 29, 2024. See graphic for full index names. Ratios based on trailing 12 month financials. The price to earnings ratio excludes companies with negative earnings.
On average, European valuations are nearly 50% lower than U.S. valuations, potentially offering an affordable entry point for investors.
Research also shows that lower price ratios have historically led to higher long-term returns.
Market Movements Not Closely Connected
Over the last decade, the European stock market had low-to-moderate correlation with North American and Asian equities.
The below chart shows correlations from February 2014 to February 2024. A value closer to zero indicates low correlation, while a value of one would indicate that two regions are moving in perfect unison.
| EURO STOXX 50 | STOXX EUROPE 600 | U.S. | Canada | Japan | Asia Pacific ex. China |
|
|---|---|---|---|---|---|---|
| EURO STOXX 50 | 1.00 | 0.97 | 0.55 | 0.67 | 0.24 | 0.43 |
| STOXX EUROPE 600 | 1.00 | 0.56 | 0.71 | 0.28 | 0.48 | |
| U.S. | 1.00 | 0.73 | 0.12 | 0.25 | ||
| Canada | 1.00 | 0.22 | 0.40 | |||
| Japan | 1.00 | 0.88 | ||||
| Asia Pacific ex. China | 1.00 |
Data is based on daily USD returns.
European equities had relatively independent market movements from North American and Asian markets. One contributing factor could be the differing sector weights in each market. For instance, technology makes up a quarter of the U.S. market, but health care and industrials dominate the broader European market.
Ultimately, European equities can enhance portfolio diversification and have the potential to mitigate risk for investors.
Tracking the Market
For investors interested in European equities, STOXX offers a variety of flagship indices:
| Index | Description | Market Cap |
|---|---|---|
| STOXX Europe 600 | Pan-regional, broad market | €10.5T |
| STOXX Developed Europe | Pan-regional, broad-market | €9.9T |
| STOXX Europe 600 ESG-X | Pan-regional, broad market, sustainability focus | €9.7T |
| STOXX Europe 50 | Pan-regional, blue-chip | €5.1T |
| EURO STOXX 50 | Eurozone, blue-chip | €3.5T |
Data is as of February 29, 2024. Market cap is free float, which represents the shares that are readily available for public trading on stock exchanges.
The EURO STOXX 50 tracks the Eurozone’s biggest and most traded companies. It also underlies one of the world’s largest ranges of ETFs and mutual funds. As of November 2023, there were €27.3 billion in ETFs and €23.5B in mutual fund assets under management tracking the index.
“For the past 25 years, the EURO STOXX 50 has served as an accurate, reliable and tradable representation of the Eurozone equity market.”
— Axel Lomholt, General Manager at STOXX
Partnering with STOXX to Track the European Stock Market
Are you interested in European equities? STOXX can be a valuable partner:
- Comprehensive, liquid and investable ecosystem
- European heritage, global reach
- Highly sophisticated customization capabilities
- Open architecture approach to using data
- Close partnerships with clients
- Part of ISS STOXX and Deutsche Börse Group
With a full suite of indices, STOXX can help you benchmark against the European stock market.
Learn how STOXX’s European indices offer liquid and effective market access.

-

 Economy3 days ago
Economic Growth Forecasts for G7 and BRICS Countries in 2024
The IMF has released its economic growth forecasts for 2024. How do the G7 and BRICS countries compare?
-

 Markets2 weeks ago
U.S. Debt Interest Payments Reach $1 Trillion
U.S. debt interest payments have surged past the $1 trillion dollar mark, amid high interest rates and an ever-expanding debt burden.
-

 United States2 weeks ago
Ranked: The Largest U.S. Corporations by Number of Employees
We visualized the top U.S. companies by employees, revealing the massive scale of retailers like Walmart, Target, and Home Depot.
-

 Markets2 weeks ago
The Top 10 States by Real GDP Growth in 2023
This graphic shows the states with the highest real GDP growth rate in 2023, largely propelled by the oil and gas boom.
-

 Markets3 weeks ago
Ranked: The World’s Top Flight Routes, by Revenue
In this graphic, we show the highest earning flight routes globally as air travel continued to rebound in 2023.
-

 Markets3 weeks ago
Ranked: The Most Valuable Housing Markets in America
The U.S. residential real estate market is worth a staggering $47.5 trillion. Here are the most valuable housing markets in the country.


-

 Sports1 week ago
The Highest Earning Athletes in Seven Professional Sports
-

 Countries2 weeks ago
Population Projections: The World’s 6 Largest Countries in 2075
-
Markets2 weeks ago
The Top 10 States by Real GDP Growth in 2023
-

 Demographics2 weeks ago
The Smallest Gender Wage Gaps in OECD Countries
-

 United States2 weeks ago
Where U.S. Inflation Hit the Hardest in March 2024
-

 Green2 weeks ago
Top Countries By Forest Growth Since 2001
-
United States2 weeks ago
Ranked: The Largest U.S. Corporations by Number of Employees
-

 Maps2 weeks ago
The Largest Earthquakes in the New York Area (1970-2024)