Markets
The U.S. Banks With the Highest Exposure to Commercial Real Estate
![]() See this visualization first on the Voronoi app.
See this visualization first on the Voronoi app.
U.S. Banks With the Most Commercial Real Estate Exposure
This was originally posted on our Voronoi app. Download the app for free on iOS or Android and discover incredible data-driven charts from a variety of trusted sources.
Today, there is roughly $5.7 trillion in commercial real estate debt outstanding—with U.S. banks holding approximately half of this total on their balance sheets.
The commercial property sector, which includes office, retail, healthcare, and multi-family properties, has faced mounting pressures amid high interest rates and lower occupancy levels. Given these headwinds, it poses the risk of higher defaults and steep loan losses in a sector that has not fully recovered since the collapse of Silicon Valley Bank last year.
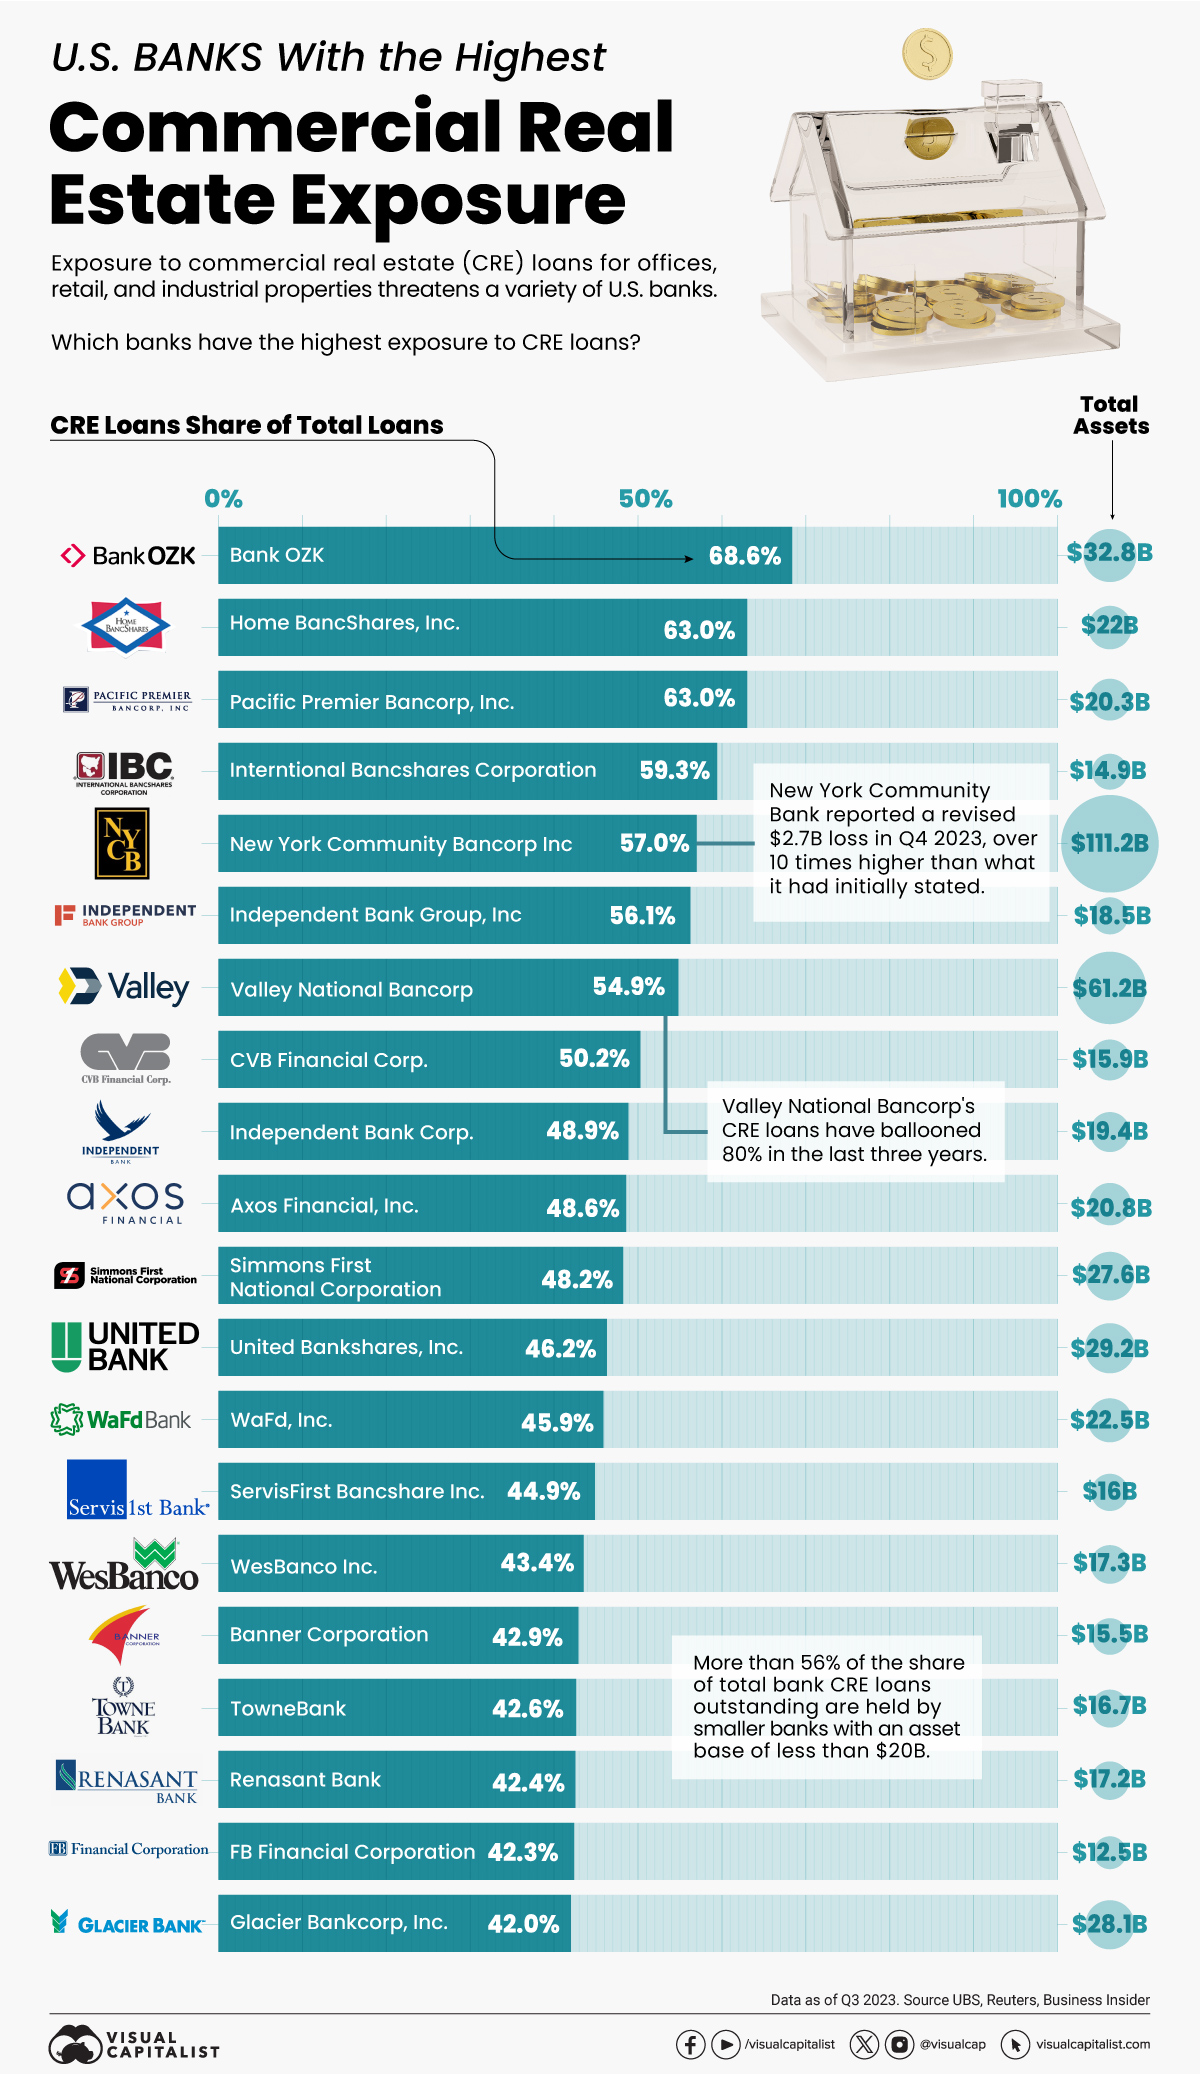
This graphic shows the U.S. banks with the highest exposure to the commercial real estate sector, based on analysis from UBS.
Top U.S. Banks, by Share of Commercial Property Loans
Here are the banks with the greatest concentration of commercial property loans as of the third quarter of 2023:
| Bank | Commercial Real Estate Share of Total Loans | Total Commercial Real Estate Loans | Total Assets |
|---|---|---|---|
| Bank OZK | 68.6% | $17.4B | $32.8B |
| Home BancShares, Inc. | 63.0% | $9.0B | $22.0B |
| Pacific Premier Bancorp, Inc. | 63.0% | $8.4B | $20.3B |
| International Bancshares Corporation | 59.3% | $4.7B | $14.9B |
| New York Community Bancorp Inc | 57.0% | $49.0B | $111.2B |
| Independent Bank Group, Inc. | 56.1% | $8.0B | $18.5B |
| Valley National Bancorp | 54.9% | $27.5B | $61.2B |
| CVB Financial Corp. | 50.2% | $4.5B | $15.9B |
| Independent Bank Corp. | 48.9% | $7.0B | $19.4B |
| Axos Financial, Inc. | 48.6% | $8.3B | $20.8B |
| Simmons First National Corporation Class A | 48.2% | $8.1B | $27.6B |
| United Bankshares, Inc. | 46.2% | $9.8B | $29.2B |
| WaFd, Inc. | 45.9% | $8.1B | $22.5B |
| ServisFirst Bancshares Inc | 44.9% | $5.2B | $16.0B |
| WesBanco, Inc. | 43.4% | $4.9B | $17.3B |
| Banner Corporation | 42.9% | $4.6B | $15.5B |
| TowneBank | 42.6% | $4.8B | $16.7B |
| Renasant Corporation | 42.4% | $5.3B | $17.2B |
| FB Financial Corporation | 42.3% | $4.0B | $12.5B |
| Glacier Bancorp, Inc. | 42.0% | $6.8B | $28.1B |
As the above table shows, the vast majority of banks with the greatest exposure are small and medium-sized financial institutions.
Bank OZK, based in Arkansas, has the highest proportion of commercial property loans, at 68.6% of total loans. As one of the country’s most prominent lenders to Manhattan property developers, its share price has outperformed the S&P 500 by tenfold since going public 27 years ago.
New York Community Bancorp, the only big bank on the list, has $49 billion in commercial property loans, making up 57% of its overall loans. At the height of regional banking turmoil last year, one of New York Community Bancorp’s subsidiaries took over the failed Signature Bank in a multi-billion dollar deal.
Since the bank reported $2.7 billion in losses in the fourth quarter of 2023, its share price has plummeted roughly 68%. The surprise loss—which was revised from $252 million—prompted the bank to seek a $1 billion lifeline from investors to help shore up confidence in the institution. Former U.S. Treasury Secretary Steven Mnunchin was a major investor in the deal.
Like New York Community Bancorp, a number of other regional banks have seen their share prices lag due to its fallout.
Commercial Property Debt Concentrated in Small Banks
Below, we show how the majority of commercial real estate loans are found in small U.S. banks, which are those with assets of $20 billion and under:
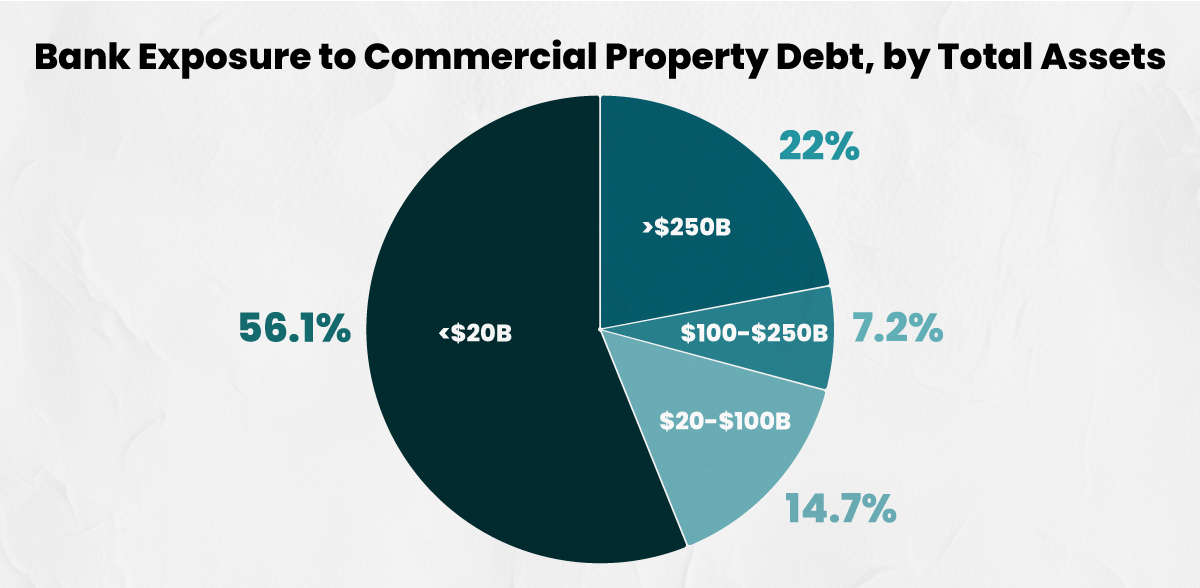
With 56.1% of all commercial property loans, small U.S. banks face the highest risk compared to other bigger banks.
Given the high share of loans, banks may run the risk of failure especially if credit losses accelerate and valuations decline. At the same time, it could be more challenging to refinance debt as valuations deteriorate.
While these troubles have begun to emerge over the last year, there is also the likelihood that losses could continue over the next several years. In fact, after the global financial crisis, credit losses peaked two years after delinquencies hit their highest point.


Markets
The European Stock Market: Attractive Valuations Offer Opportunities
On average, the European stock market has valuations that are nearly 50% lower than U.S. valuations. But how can you access the market?


European Stock Market: Attractive Valuations Offer Opportunities
Europe is known for some established brands, from L’Oréal to Louis Vuitton. However, the European stock market offers additional opportunities that may be lesser known.
The above infographic, sponsored by STOXX, outlines why investors may want to consider European stocks.
Attractive Valuations
Compared to most North American and Asian markets, European stocks offer lower or comparable valuations.
| Index | Price-to-Earnings Ratio | Price-to-Book Ratio |
|---|---|---|
| EURO STOXX 50 | 14.9 | 2.2 |
| STOXX Europe 600 | 14.4 | 2 |
| U.S. | 25.9 | 4.7 |
| Canada | 16.1 | 1.8 |
| Japan | 15.4 | 1.6 |
| Asia Pacific ex. China | 17.1 | 1.8 |
Data as of February 29, 2024. See graphic for full index names. Ratios based on trailing 12 month financials. The price to earnings ratio excludes companies with negative earnings.
On average, European valuations are nearly 50% lower than U.S. valuations, potentially offering an affordable entry point for investors.
Research also shows that lower price ratios have historically led to higher long-term returns.
Market Movements Not Closely Connected
Over the last decade, the European stock market had low-to-moderate correlation with North American and Asian equities.
The below chart shows correlations from February 2014 to February 2024. A value closer to zero indicates low correlation, while a value of one would indicate that two regions are moving in perfect unison.
| EURO STOXX 50 | STOXX EUROPE 600 | U.S. | Canada | Japan | Asia Pacific ex. China |
|
|---|---|---|---|---|---|---|
| EURO STOXX 50 | 1.00 | 0.97 | 0.55 | 0.67 | 0.24 | 0.43 |
| STOXX EUROPE 600 | 1.00 | 0.56 | 0.71 | 0.28 | 0.48 | |
| U.S. | 1.00 | 0.73 | 0.12 | 0.25 | ||
| Canada | 1.00 | 0.22 | 0.40 | |||
| Japan | 1.00 | 0.88 | ||||
| Asia Pacific ex. China | 1.00 |
Data is based on daily USD returns.
European equities had relatively independent market movements from North American and Asian markets. One contributing factor could be the differing sector weights in each market. For instance, technology makes up a quarter of the U.S. market, but health care and industrials dominate the broader European market.
Ultimately, European equities can enhance portfolio diversification and have the potential to mitigate risk for investors.
Tracking the Market
For investors interested in European equities, STOXX offers a variety of flagship indices:
| Index | Description | Market Cap |
|---|---|---|
| STOXX Europe 600 | Pan-regional, broad market | €10.5T |
| STOXX Developed Europe | Pan-regional, broad-market | €9.9T |
| STOXX Europe 600 ESG-X | Pan-regional, broad market, sustainability focus | €9.7T |
| STOXX Europe 50 | Pan-regional, blue-chip | €5.1T |
| EURO STOXX 50 | Eurozone, blue-chip | €3.5T |
Data is as of February 29, 2024. Market cap is free float, which represents the shares that are readily available for public trading on stock exchanges.
The EURO STOXX 50 tracks the Eurozone’s biggest and most traded companies. It also underlies one of the world’s largest ranges of ETFs and mutual funds. As of November 2023, there were €27.3 billion in ETFs and €23.5B in mutual fund assets under management tracking the index.
“For the past 25 years, the EURO STOXX 50 has served as an accurate, reliable and tradable representation of the Eurozone equity market.”
— Axel Lomholt, General Manager at STOXX
Partnering with STOXX to Track the European Stock Market
Are you interested in European equities? STOXX can be a valuable partner:
- Comprehensive, liquid and investable ecosystem
- European heritage, global reach
- Highly sophisticated customization capabilities
- Open architecture approach to using data
- Close partnerships with clients
- Part of ISS STOXX and Deutsche Börse Group
With a full suite of indices, STOXX can help you benchmark against the European stock market.
Learn how STOXX’s European indices offer liquid and effective market access.

-

 Economy3 days ago
Economic Growth Forecasts for G7 and BRICS Countries in 2024
The IMF has released its economic growth forecasts for 2024. How do the G7 and BRICS countries compare?
-

 Markets2 weeks ago
U.S. Debt Interest Payments Reach $1 Trillion
U.S. debt interest payments have surged past the $1 trillion dollar mark, amid high interest rates and an ever-expanding debt burden.
-

 United States2 weeks ago
Ranked: The Largest U.S. Corporations by Number of Employees
We visualized the top U.S. companies by employees, revealing the massive scale of retailers like Walmart, Target, and Home Depot.
-

 Markets2 weeks ago
The Top 10 States by Real GDP Growth in 2023
This graphic shows the states with the highest real GDP growth rate in 2023, largely propelled by the oil and gas boom.
-

 Markets2 weeks ago
Ranked: The World’s Top Flight Routes, by Revenue
In this graphic, we show the highest earning flight routes globally as air travel continued to rebound in 2023.
-

 Markets3 weeks ago
Ranked: The Most Valuable Housing Markets in America
The U.S. residential real estate market is worth a staggering $47.5 trillion. Here are the most valuable housing markets in the country.


-

 Debt1 week ago
How Debt-to-GDP Ratios Have Changed Since 2000
-
Markets2 weeks ago
Ranked: The World’s Top Flight Routes, by Revenue
-

 Countries2 weeks ago
Population Projections: The World’s 6 Largest Countries in 2075
-
Markets2 weeks ago
The Top 10 States by Real GDP Growth in 2023
-

 Demographics2 weeks ago
The Smallest Gender Wage Gaps in OECD Countries
-

 United States2 weeks ago
Where U.S. Inflation Hit the Hardest in March 2024
-

 Green2 weeks ago
Top Countries By Forest Growth Since 2001
-
United States2 weeks ago
Ranked: The Largest U.S. Corporations by Number of Employees