Markets
Visualized: The 100 Largest U.S. Banks by Consolidated Assets
View the high-resolution version of this infographic.


The 100 Largest U.S. Banks by Consolidated Assets
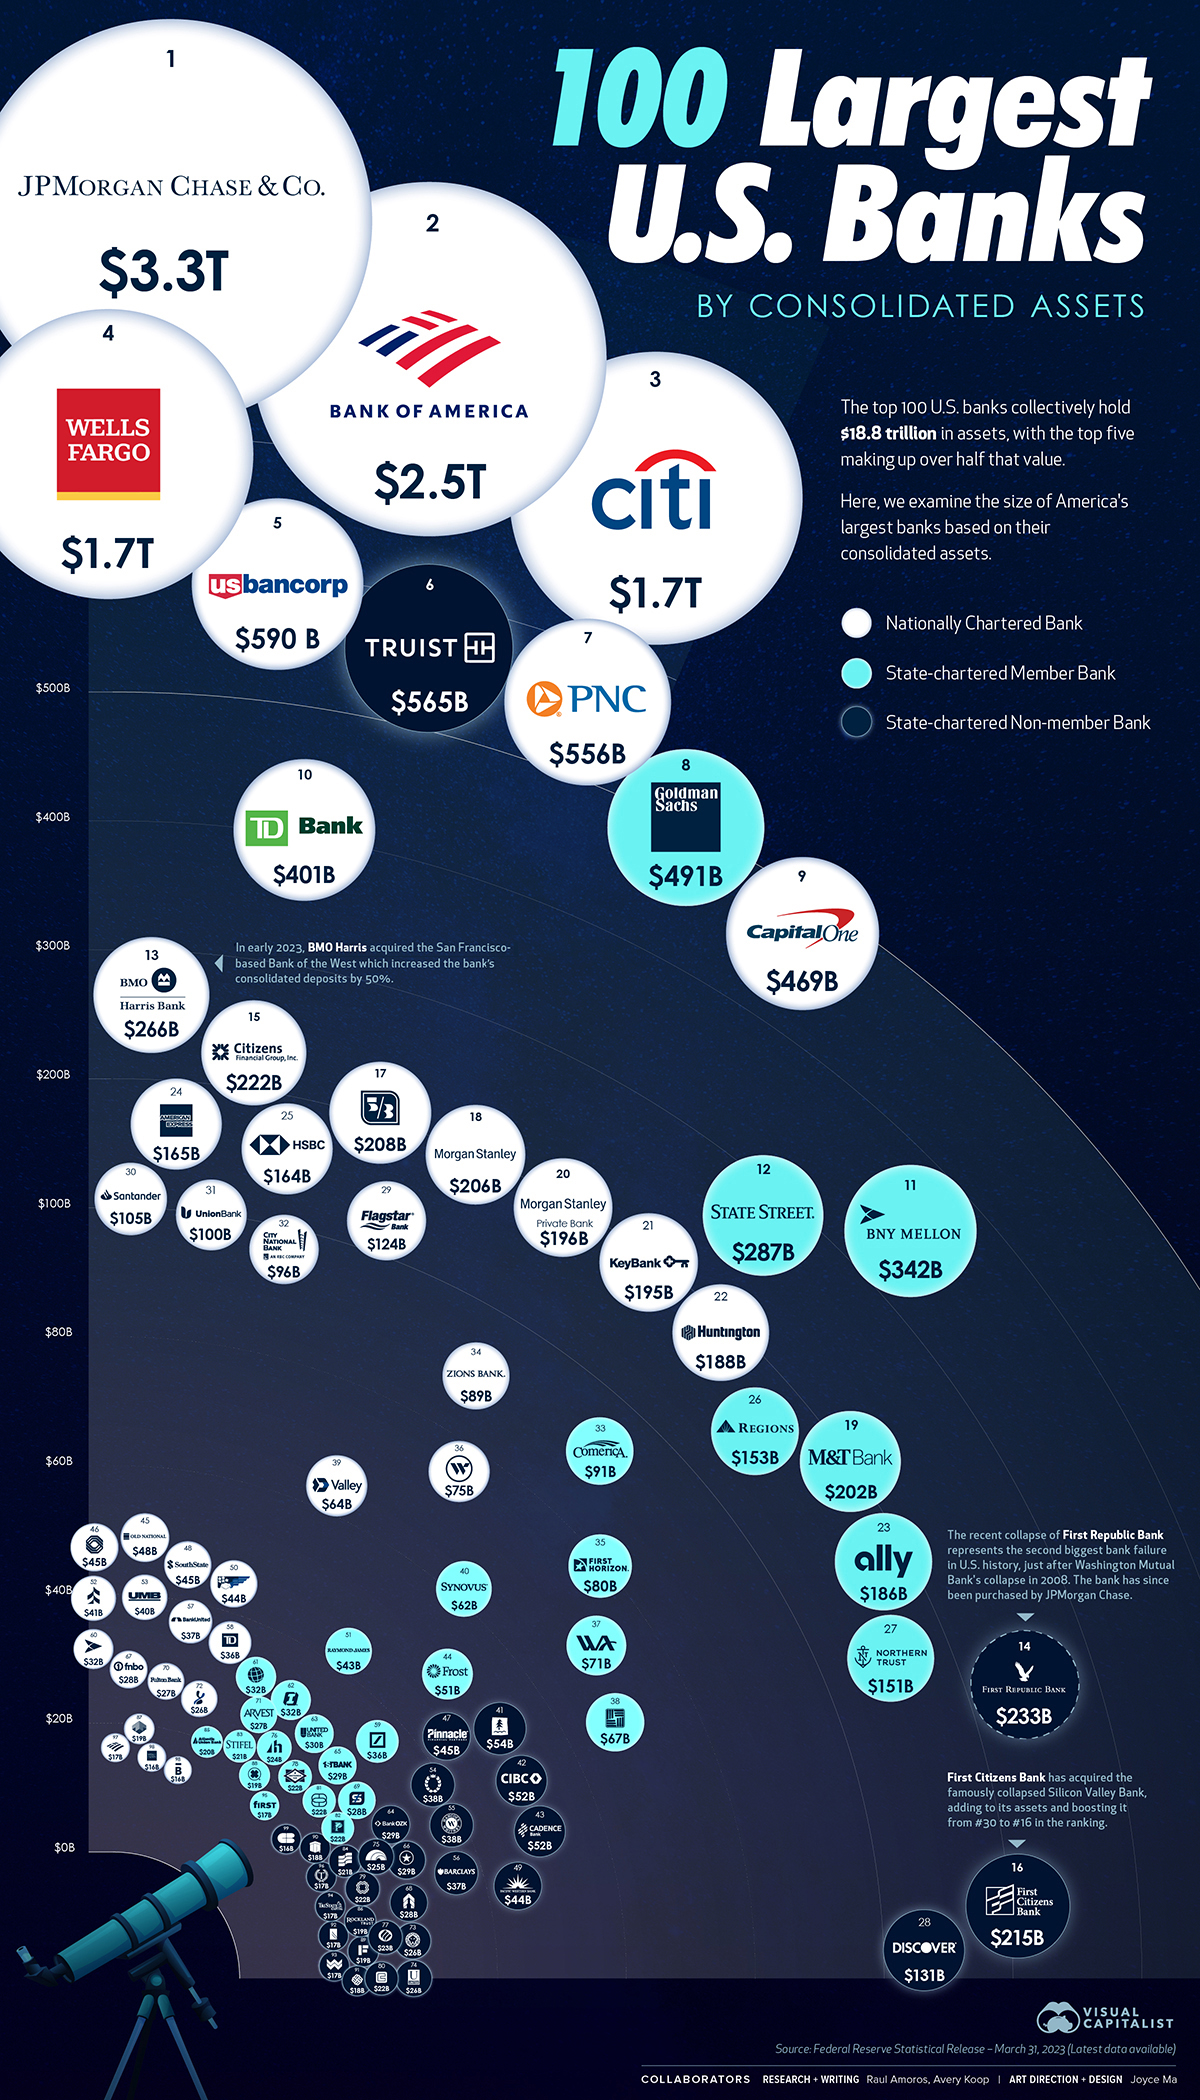
The largest 100 banks in the U.S. hold a combined $18.8 trillion in consolidated assets, but recent collapses of medium-sized banks like Silicon Valley Bank and First Republic have caused worries throughout the banking world.
This visual using data from the Federal Reserve ranks the country’s 100 largest banks by the size of their consolidated assets.
The Top 100 Banks
America’s biggest bank is JP Morgan Chase with over $3.3 trillion in assets, with Bank of America trailing behind in second place with $2.5 trillion. Here’s a closer look at the numbers:
| Rank | Bank / Holding Co Name | Consolidated Assets ($ Millions) |
|---|---|---|
| #1 | JP Morgan Chase Bank | $3,267,963 |
| #2 | Bank of America | $2,518,290 |
| #3 | Citibank | $1,721,547 |
| #4 | Wells Fargo | $1,687,507 |
| #5 | US Bancorp | $590,460 |
| #6 | Truist Bank | $564,837 |
| #7 | PNC Bank | $556,314 |
| #8 | Goldman Sachs | $490,799 |
| #9 | Capital One | $469,432 |
| #10 | TD Bank | $401,245 |
| #11 | Bank of NY Mellon | $341,455 |
| #12 | State Street | $287,069 |
| #13 | BMO Harris Bank | $265,446 |
| #14 | First Republic | $232,944 |
| #15 | Citizens Bank | $221,955 |
| #16 | First Citizens Bank | $214,599 |
| #17 | Fifth Third Bank | $207,586 |
| #18 | Morgan Stanely | $205,845 |
| #19 | Manufacturers and Traders Bank | $202,363 |
| #20 | Morgan Stanley Private Bank | $195,667 |
| #21 | Keybank | $195,191 |
| #22 | Huntington National Bank | $188,441 |
| #23 | Ally Bank | $186,383 |
| #24 | American Express | $165,450 |
| #25 | HSBC Bank USA | $164,492 |
| #26 | Regions Bank | $153,125 |
| #27 | Northern Trust | $150,573 |
| #28 | Discover Bank | $130,703 |
| #29 | Flagstar Bank | $123,633 |
| #30 | Santander Bank | $105,314 |
| #31 | MUFG Union Bank | $99,964 |
| #32 | City National Bank | $96,370 |
| #33 | Comerica Bank | $91,259 |
| #34 | Zions Bank | $88,574 |
| #35 | First Horizon Bank | $80,465 |
| #36 | Webster Bank | $74,793 |
| #37 | Western Alliance Bank | $70,986 |
| #38 | East West Bank | $67,219 |
| #39 | Valley National Bank | $64,314 |
| #40 | Synovus Bank | $61,726 |
| #41 | Umqua Bank | $53,986 |
| #42 | CIBC | $52,146 |
| #43 | Cadence Bank | $51,693 |
| #44 | Frost Bank | $51,286 |
| #45 | Old National Bank | $47,554 |
| #46 | BOK Financial | $45,269 |
| #47 | Pinnacle Bank | $44,988 |
| #48 | Southstate Bank | $44,903 |
| #49 | Pacific Western Bank | $44,255 |
| #50 | First National Bank of Pennsylvania | $44,132 |
| #51 | Raymond James Bank | $43,359 |
| #52 | Associated Bank | $40,653 |
| #53 | UMB Bank | $40,354 |
| #54 | Prosperity Bank | $37,829 |
| #55 | Hancock Whitney Bank | $37,525 |
| #56 | Barclays Bank | $37,352 |
| #57 | United Bank | $37,095 |
| #58 | TD Bank | $36,460 |
| #59 | Deutsche Bank | $36,103 |
| #60 | BNY Mellon | $31,945 |
| #61 | Commerce Bank | $31,853 |
| #62 | First Interest Bank | $31,565 |
| #63 | United Bank | $30,108 |
| #64 | Bank OZK | $28,971 |
| #65 | Firstbank | $28,764 |
| #66 | Texas Capital | $28,592 |
| #67 | First National Bank of Omaha | $28,393 |
| #68 | Glacier Bank | $27,785 |
| #69 | Simmons Bank | $27,538 |
| #70 | Fulton Bank | $26,996 |
| #71 | Arvest Bank | $26,946 |
| #72 | City National Bank of Florida | $26,204 |
| #73 | Ameris Bank | $25,991 |
| #74 | United Community Bank | $25,815 |
| #75 | First Hawaiian Bank | $24,883 |
| #76 | Bank of Hawaii | $23,904 |
| #77 | Eastern Bank | $22,702 |
| #78 | Centennial Bank | $22,452 |
| #79 | Washington Federal Bank | $22,320 |
| #80 | Cathay Bank | $22,016 |
| #81 | Customers Bank | $21,768 |
| #82 | Pacific Premier Bank | $21,362 |
| #83 | Stifel Banking and Lending | $20,969 |
| #84 | Bank of Hope | $20,564 |
| #85 | Atlantic Union Bank | $19,990 |
| #86 | Rockland Trust | $19,445 |
| #87 | Trustmark National Bank | $18,875 |
| #88 | Central Bancompany | $18,850 |
| #89 | DBA Independent Financial | $18,793 |
| #90 | First Merchants Bank | $18,165 |
| #91 | Mechanics Bank | $17,946 |
| #92 | Renasant Bank | $17,479 |
| #93 | Wesbanco | $17,237 |
| #94 | Tristate Capital Bank | $17,050 |
| #95 | First Financial Bank | $16,857 |
| #96 | Townebank | $16,730 |
| #97 | Bank of America | $16,550 |
| #98 | Wells Fargo | $16,473 |
| #99 | Citizens Bank | $16,271 |
| #100 | Bremer Bank | $15,763 |
The first and second place banks combined account for around 30% of the consolidated assets on this list. On the flip side, the smallest bank is Bremer Bank at $15.8 billion in consolidated assets. While this seems small in the context of this list, there are actually thousands of even smaller commercial financial institutions in the country.
Many banks have seen significant changes to their ranking since the last Fed data at the end of 2022. BMO Harris moved up 10 spots, going from $177 billion in consolidated assets to $265 billion—an increase of 50%. In February, the bank acquired the San Francisco-based Bank of the West (which previously ranked 34th on this list).
First Citizens also saw its rank improve, going from 30th to 16th, thanks to the acquisition of the remnants of Silicon Valley Bank.
In May 2023, a planned merger between First Horizon and TD Bank was mutually terminated. The merger, had it gone ahead, would have seen TD Bank surpass the size of Capital One.
Banking Heavyweights
Typically, big banks are less of a risk for borrowers in terms of their liquidity, holding huge sums in diversified assets, whereas smaller and more regional American banks have a narrower margin for error. However, many other factors beyond size play into risk, like an institution’s loan portfolio or management style.
Volatility in the banking sector is expected to have implications on the wider economy. For example, bank lending capacity is expected to decrease by 1% this year, a shift which the IMF expects will take almost half a percentage point off the U.S.’ overall GDP.
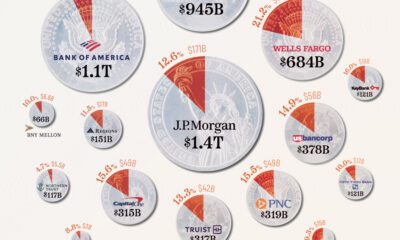
The largest banks have set aside billions in anticipation of bad loans as a result of pressure from rising interest rates. JP Morgan Chase currently has $2.3 billion in provisions/reserves built. Here’s a look at some of the current reserves that banks have set aside based on most recent data:
| Bank | Reserves Built / Reserves Released | As of |
|---|---|---|
| JP Morgan Chase | $2.3 billion | Q1 2023 |
| Wells Fargo | $1.2 billion | Q1 2023 |
| Goldman Sachs | $972 million | Q4 2022 |
| Citigroup | $241 million | Q1 2023 |
| Morgan Stanley | $234 million | Q1 2023 |
| Bank of America | $124 million | Q1 2023 |
Bank Volatility
Small and medium sized banks (<$250 billion in assets) play an important role in the economy. Collectively, these banks are responsible for 45% of consumer lending and 80% of commercial real estate lending.
However, lending by these banks has been tightening up, given the current economic conditions and fears around bank collapses.
Overall, continued turmoil in the banking sector would likely reduce profitability for banks and ultimately slow economic growth.


Markets
The European Stock Market: Attractive Valuations Offer Opportunities
On average, the European stock market has valuations that are nearly 50% lower than U.S. valuations. But how can you access the market?


European Stock Market: Attractive Valuations Offer Opportunities
Europe is known for some established brands, from L’Oréal to Louis Vuitton. However, the European stock market offers additional opportunities that may be lesser known.
The above infographic, sponsored by STOXX, outlines why investors may want to consider European stocks.
Attractive Valuations
Compared to most North American and Asian markets, European stocks offer lower or comparable valuations.
| Index | Price-to-Earnings Ratio | Price-to-Book Ratio |
|---|---|---|
| EURO STOXX 50 | 14.9 | 2.2 |
| STOXX Europe 600 | 14.4 | 2 |
| U.S. | 25.9 | 4.7 |
| Canada | 16.1 | 1.8 |
| Japan | 15.4 | 1.6 |
| Asia Pacific ex. China | 17.1 | 1.8 |
Data as of February 29, 2024. See graphic for full index names. Ratios based on trailing 12 month financials. The price to earnings ratio excludes companies with negative earnings.
On average, European valuations are nearly 50% lower than U.S. valuations, potentially offering an affordable entry point for investors.
Research also shows that lower price ratios have historically led to higher long-term returns.
Market Movements Not Closely Connected
Over the last decade, the European stock market had low-to-moderate correlation with North American and Asian equities.
The below chart shows correlations from February 2014 to February 2024. A value closer to zero indicates low correlation, while a value of one would indicate that two regions are moving in perfect unison.
| EURO STOXX 50 | STOXX EUROPE 600 | U.S. | Canada | Japan | Asia Pacific ex. China |
|
|---|---|---|---|---|---|---|
| EURO STOXX 50 | 1.00 | 0.97 | 0.55 | 0.67 | 0.24 | 0.43 |
| STOXX EUROPE 600 | 1.00 | 0.56 | 0.71 | 0.28 | 0.48 | |
| U.S. | 1.00 | 0.73 | 0.12 | 0.25 | ||
| Canada | 1.00 | 0.22 | 0.40 | |||
| Japan | 1.00 | 0.88 | ||||
| Asia Pacific ex. China | 1.00 |
Data is based on daily USD returns.
European equities had relatively independent market movements from North American and Asian markets. One contributing factor could be the differing sector weights in each market. For instance, technology makes up a quarter of the U.S. market, but health care and industrials dominate the broader European market.
Ultimately, European equities can enhance portfolio diversification and have the potential to mitigate risk for investors.
Tracking the Market
For investors interested in European equities, STOXX offers a variety of flagship indices:
| Index | Description | Market Cap |
|---|---|---|
| STOXX Europe 600 | Pan-regional, broad market | €10.5T |
| STOXX Developed Europe | Pan-regional, broad-market | €9.9T |
| STOXX Europe 600 ESG-X | Pan-regional, broad market, sustainability focus | €9.7T |
| STOXX Europe 50 | Pan-regional, blue-chip | €5.1T |
| EURO STOXX 50 | Eurozone, blue-chip | €3.5T |
Data is as of February 29, 2024. Market cap is free float, which represents the shares that are readily available for public trading on stock exchanges.
The EURO STOXX 50 tracks the Eurozone’s biggest and most traded companies. It also underlies one of the world’s largest ranges of ETFs and mutual funds. As of November 2023, there were €27.3 billion in ETFs and €23.5B in mutual fund assets under management tracking the index.
“For the past 25 years, the EURO STOXX 50 has served as an accurate, reliable and tradable representation of the Eurozone equity market.”
— Axel Lomholt, General Manager at STOXX
Partnering with STOXX to Track the European Stock Market
Are you interested in European equities? STOXX can be a valuable partner:
- Comprehensive, liquid and investable ecosystem
- European heritage, global reach
- Highly sophisticated customization capabilities
- Open architecture approach to using data
- Close partnerships with clients
- Part of ISS STOXX and Deutsche Börse Group
With a full suite of indices, STOXX can help you benchmark against the European stock market.
Learn how STOXX’s European indices offer liquid and effective market access.

-

 Economy3 days ago
Economic Growth Forecasts for G7 and BRICS Countries in 2024
The IMF has released its economic growth forecasts for 2024. How do the G7 and BRICS countries compare?
-

 Markets2 weeks ago
U.S. Debt Interest Payments Reach $1 Trillion
U.S. debt interest payments have surged past the $1 trillion dollar mark, amid high interest rates and an ever-expanding debt burden.
-

 United States2 weeks ago
Ranked: The Largest U.S. Corporations by Number of Employees
We visualized the top U.S. companies by employees, revealing the massive scale of retailers like Walmart, Target, and Home Depot.
-

 Markets2 weeks ago
The Top 10 States by Real GDP Growth in 2023
This graphic shows the states with the highest real GDP growth rate in 2023, largely propelled by the oil and gas boom.
-

 Markets3 weeks ago
Ranked: The World’s Top Flight Routes, by Revenue
In this graphic, we show the highest earning flight routes globally as air travel continued to rebound in 2023.
-

 Markets3 weeks ago
Ranked: The Most Valuable Housing Markets in America
The U.S. residential real estate market is worth a staggering $47.5 trillion. Here are the most valuable housing markets in the country.


-

 Sports1 week ago
The Highest Earning Athletes in Seven Professional Sports
-

 Countries2 weeks ago
Population Projections: The World’s 6 Largest Countries in 2075
-
Markets2 weeks ago
The Top 10 States by Real GDP Growth in 2023
-

 Demographics2 weeks ago
The Smallest Gender Wage Gaps in OECD Countries
-

 United States2 weeks ago
Where U.S. Inflation Hit the Hardest in March 2024
-

 Green2 weeks ago
Top Countries By Forest Growth Since 2001
-
United States2 weeks ago
Ranked: The Largest U.S. Corporations by Number of Employees
-

 Maps2 weeks ago
The Largest Earthquakes in the New York Area (1970-2024)