Markets
Visualizing Every Company on the S&P 500 Index
Subscribe to the Advisor Channel free mailing list for more like this
S&P 500 Companies: A Complete Visual Breakdown
This was originally posted on Advisor Channel. Sign up to the free mailing list to get beautiful visualizations on financial markets that help advisors and their clients.
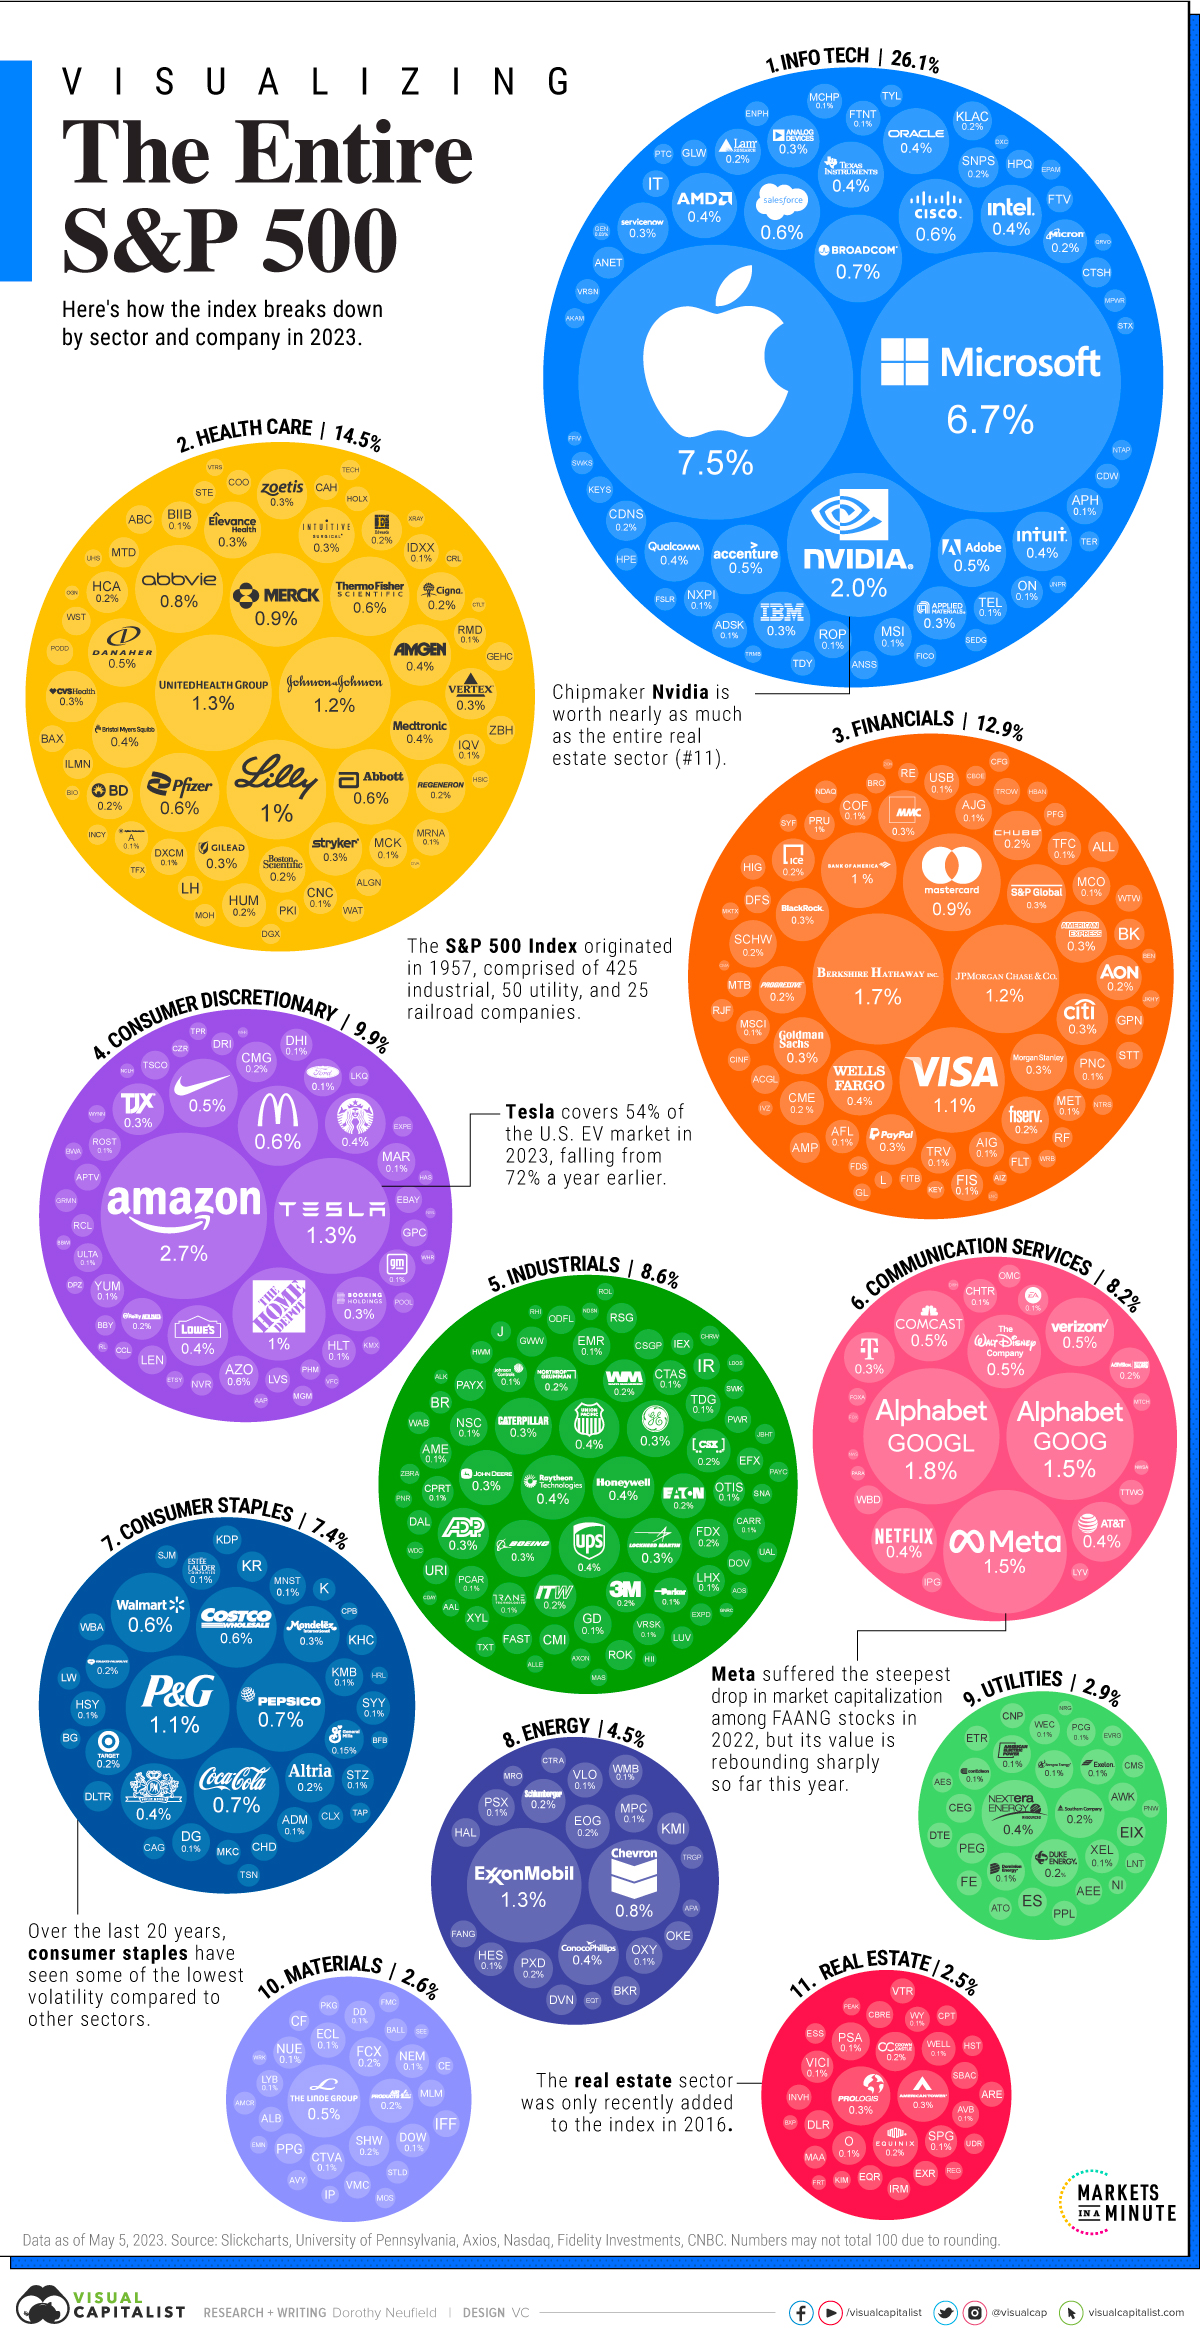
S&P 500 companies hold $7.1 trillion in assets, and account for close to 80% of available market capitalization on U.S. stock exchanges.
The index serves as a barometer for the U.S. stock market, covering the largest public U.S. companies by market capitalization. Often, it reflects investor sentiment and is considered an indicator for U.S. economic health.
As the S&P 500 enters a bull market after the longest downturn in decades, the above graphic shows the entire makeup of one of the world’s largest markets.
Top S&P 500 Companies, by Weight
Here are the 100 biggest S&P 500 companies by sector and weight, using data from Slickcharts. Data is as of May 5, 2023.
Rank, by Weight | Name | Sector | Weight (%) |
|---|---|---|---|
| 1 | Apple | Info Tech | 7.46 |
| 2 | Microsoft | Info Tech | 6.69 |
| 3 | Amazon.com | Consumer Discretionary | 2.72 |
| 4 | Nvidia | Info Tech | 2.04 |
| 5 | Alphabet Inc. Class A | Communication Services | 1.82 |
| 6 | Berkshire Hathaway | Financials | 1.69 |
| 7 | Alphabet Inc. Class C | Communication Services | 1.59 |
| 8 | Meta Platforms | Communication Services | 1.50 |
| 9 | UnitedHealth Group | Health Care | 1.34 |
| 10 | Tesla | Consumer Discretionary | 1.32 |
| 11 | Exxon Mobil | Energy | 1.29 |
| 12 | Johnson & Johnson | Health Care | 1.23 |
| 13 | JPMorgan Chase | Financials | 1.16 |
| 14 | Visa | Financials | 1.09 |
| 15 | Procter & Gamble | Consumer Staples | 1.06 |
| 16 | Eli Lilly | Health Care | 0.98 |
| 17 | Mastercard | Financials | 0.94 |
| 18 | Merck & Co. | Health Care | 0.86 |
| 19 | Home Depot | Consumer Discretionary | 0.85 |
| 20 | Chevron | Energy | 0.82 |
| 21 | PepsiCo | Consumer Staples | 0.77 |
| 22 | Broadcom | Info Tech | 0.76 |
| 23 | AbbVie | Health Care | 0.76 |
| 24 | Coca-Cola | Consumer Staples | 0.72 |
| 25 | Costco | Consumer Staples | 0.64 |
| 26 | McDonald's | Consumer Discretionary | 0.63 |
| 27 | Pfizer | Health Care | 0.62 |
| 28 | Thermo Fisher Scientific | Health Care | 0.62 |
| 29 | Walmart | Consumer Staples | 0.62 |
| 30 | Salesforce | Info Tech | 0.57 |
| 31 | Abbott Laboratories | Health Care | 0.56 |
| 32 | Bank of America | Financials | 0.56 |
| 33 | Cisco Systems | Info Tech | 0.55 |
| 34 | Walt Disney Company | Communication Services | 0.53 |
| 35 | Linde plc | Materials | 0.52 |
| 36 | Comcast Corporation | Communication Services | 0.49 |
| 37 | Accenture | Info Tech | 0.48 |
| 38 | Adobe | Info Tech | 0.46 |
| 39 | Danaher | Health Care | 0.46 |
| 40 | Verizon | Communication Services | 0.46 |
| 41 | NIKE | Consumer Discretionary | 0.46 |
| 42 | Texas Instruments | Info Tech | 0.43 |
| 43 | NextEra Energy | Utilities | 0.43 |
| 44 | Oracle | Info Tech | 0.43 |
| 45 | Philip Morris | Consumer Staples | 0.43 |
| 46 | Bristol-Myers Squibb | Health Care | 0.42 |
| 47 | Advanced Micro Devices | Info Tech | 0.42 |
| 48 | Wells Fargo | Financials | 0.42 |
| 49 | Netflix | Communication Services | 0.42 |
| 50 | Raytheon Technologies | Industrials | 0.41 |
| 51 | Honeywell | Industrials | 0.38 |
| 52 | United Parcel Service | Industrials | 0.37 |
| 53 | Intel | Info Tech | 0.37 |
| 54 | Amgen | Health Care | 0.37 |
| 55 | Lowe's | Consumer Discretionary | 0.36 |
| 56 | Starbucks | Consumer Discretionary | 0.36 |
| 57 | Union Pacific | Industrials | 0.36 |
| 58 | ConocoPhillips | Energy | 0.36 |
| 59 | AT&T | Communication Services | 0.35 |
| 60 | QUALCOMM | Info Tech | 0.35 |
| 61 | Intuit Inc. | Info Tech | 0.35 |
| 62 | Medtronic Plc | Health Care | 0.35 |
| 63 | Prologis Inc. | Real Estate | 0.34 |
| 64 | S&P Global | Financials | 0.34 |
| 65 | Caterpillar | Industrials | 0.32 |
| 66 | International Business Machines | Info Tech | 0.32 |
| 67 | Boeing | Industrials | 0.32 |
| 68 | Elevance Health | Health Care | 0.32 |
| 69 | Morgan Stanley | Financials | 0.32 |
| 70 | Goldman Sachs Group | Financials | 0.32 |
| 71 | General Electric | Industrials | 0.32 |
| 72 | Intuitive Surgical | Health Care | 0.31 |
| 73 | Mondelez International | Consumer Staples | 0.31 |
| 74 | Lockheed Martin | Industrials | 0.30 |
| 75 | Deere & Company | Industrials | 0.30 |
| 76 | Booking Holdings | Consumer Discretionary | 0.29 |
| 77 | Gilead Sciences | Health Care | 0.29 |
| 78 | Applied Materials | Info Tech | 0.28 |
| 79 | BlackRock | Financials | 0.28 |
| 80 | Stryker | Health Care | 0.28 |
| 81 | Analog Devices | Info Tech | 0.27 |
| 82 | American Tower | Real Estate | 0.26 |
| 83 | American Express | Financials | 0.26 |
| 84 | CVS Health | Health Care | 0.26 |
| 85 | TJX Companies | Consumer Discretionary | 0.26 |
| 86 | Citigroup | Financials | 0.26 |
| 87 | Vertex Pharmaceuticals | Health Care | 0.26 |
| 88 | Automatic Data Processing | Industrials | 0.26 |
| 89 | Marsh & McLennan Companies | Financials | 0.26 |
| 90 | ServiceNow | Info Tech | 0.26 |
| 91 | Zoetis | Health Care | 0.25 |
| 92 | T-Mobile | Communication Services | 0.25 |
| 93 | PayPal | Financials | 0.25 |
| 94 | Altria Group | Consumer Staples | 0.24 |
| 95 | Chubb | Financials | 0.24 |
| 96 | Regeneron Pharmaceuticals | Health Care | 0.24 |
| 97 | Southern Company | Utilities | 0.24 |
| 98 | Cigna | Health Care | 0.23 |
| 99 | Duke Energy | Utilities | 0.22 |
| 100 | Fiserv | Financials | 0.22 |
Over the last decade, big tech names have dominated the index.
The tech sector makes up over 26%, with Apple, Microsoft, and Nvidia as the top S&P 500 companies by market capitalization. Despite interest rates climbing at warp speed, a select number of big tech names have maintained, or even expanded their influence on the index over the last year.
In many cases, investor demand for AI-related stocks has fueled these increases.
Amazon is the third-largest company in the index. While shares tumbled in 2022 amid slowing sales, they have since rebounded by about 46% this year. Like Amazon, consumer discretionary firm Tesla has seen a strong reversal as the index’s 10th biggest stock by weight.
In the financial sector, Berkshire Hathaway has the highest weight (1.7%) while UnitedHealth Group (1.3%) is the top in health care. The health conglomerate even towers above JP Morgan Chase, the biggest bank in America.
S&P 500 Sectors and the Market Cycle
Below, we show the 11 sectors in the S&P 500, organized by weight and their typical performance over the business cycle:
- Cyclical: Rise and fall with the market cycle, often correlated to expansions or contractions
- Defensive: Typically are negatively correlated to the market cycle, with more stable earnings and dividends
| Sector | Weight | Type |
|---|---|---|
| Information Technology | 26.1% | Cyclical |
| Health Care | 14.5% | Defensive |
| Financials | 12.9% | Cyclical |
| Consumer Discretionary | 9.9% | Cyclical |
| Industrials | 8.6% | Cyclical |
| Communication Services | 8.2% | Cyclical |
| Consumer Staples | 7.4% | Defensive |
| Energy | 4.5% | Defensive |
| Utilities | 2.9% | Defensive |
| Materials | 2.6% | Cyclical |
| Real Estate | 2.5% | Cyclical |
Numbers may not total 100 due to rounding.
Information technology, health care, and financials have the highest share in the S&P 500. Together, they cover over half the index.
S&P 500 Companies: Mixed Signals in 2023
In many ways there are two major themes playing out this year so far for U.S. equities, which is the best-performing asset class year to date.
First is that seven big tech companies—Apple, Microsoft, Nvidia, Google, Tesla, Meta, and Amazon—are driving virtually all of the index’s gains. These companies have seen double or triple-digit returns this year so far. As of May 31, tech sector ETFs saw $8 billion in inflows to date, the highest across any sector.
Secondly, the energy and health care sectors have seen the highest outflows, at $9 billion and $4 billion, respectively.
Even with interest rates hitting 15-year highs, extreme greed is in the market, based on the Fear and Greed Index. This may signal higher risk in the S&P 500, since a hit to these few companies with high weightings could significantly affect the broader index.


Markets
The European Stock Market: Attractive Valuations Offer Opportunities
On average, the European stock market has valuations that are nearly 50% lower than U.S. valuations. But how can you access the market?


European Stock Market: Attractive Valuations Offer Opportunities
Europe is known for some established brands, from L’Oréal to Louis Vuitton. However, the European stock market offers additional opportunities that may be lesser known.
The above infographic, sponsored by STOXX, outlines why investors may want to consider European stocks.
Attractive Valuations
Compared to most North American and Asian markets, European stocks offer lower or comparable valuations.
| Index | Price-to-Earnings Ratio | Price-to-Book Ratio |
|---|---|---|
| EURO STOXX 50 | 14.9 | 2.2 |
| STOXX Europe 600 | 14.4 | 2 |
| U.S. | 25.9 | 4.7 |
| Canada | 16.1 | 1.8 |
| Japan | 15.4 | 1.6 |
| Asia Pacific ex. China | 17.1 | 1.8 |
Data as of February 29, 2024. See graphic for full index names. Ratios based on trailing 12 month financials. The price to earnings ratio excludes companies with negative earnings.
On average, European valuations are nearly 50% lower than U.S. valuations, potentially offering an affordable entry point for investors.
Research also shows that lower price ratios have historically led to higher long-term returns.
Market Movements Not Closely Connected
Over the last decade, the European stock market had low-to-moderate correlation with North American and Asian equities.
The below chart shows correlations from February 2014 to February 2024. A value closer to zero indicates low correlation, while a value of one would indicate that two regions are moving in perfect unison.
| EURO STOXX 50 | STOXX EUROPE 600 | U.S. | Canada | Japan | Asia Pacific ex. China |
|
|---|---|---|---|---|---|---|
| EURO STOXX 50 | 1.00 | 0.97 | 0.55 | 0.67 | 0.24 | 0.43 |
| STOXX EUROPE 600 | 1.00 | 0.56 | 0.71 | 0.28 | 0.48 | |
| U.S. | 1.00 | 0.73 | 0.12 | 0.25 | ||
| Canada | 1.00 | 0.22 | 0.40 | |||
| Japan | 1.00 | 0.88 | ||||
| Asia Pacific ex. China | 1.00 |
Data is based on daily USD returns.
European equities had relatively independent market movements from North American and Asian markets. One contributing factor could be the differing sector weights in each market. For instance, technology makes up a quarter of the U.S. market, but health care and industrials dominate the broader European market.
Ultimately, European equities can enhance portfolio diversification and have the potential to mitigate risk for investors.
Tracking the Market
For investors interested in European equities, STOXX offers a variety of flagship indices:
| Index | Description | Market Cap |
|---|---|---|
| STOXX Europe 600 | Pan-regional, broad market | €10.5T |
| STOXX Developed Europe | Pan-regional, broad-market | €9.9T |
| STOXX Europe 600 ESG-X | Pan-regional, broad market, sustainability focus | €9.7T |
| STOXX Europe 50 | Pan-regional, blue-chip | €5.1T |
| EURO STOXX 50 | Eurozone, blue-chip | €3.5T |
Data is as of February 29, 2024. Market cap is free float, which represents the shares that are readily available for public trading on stock exchanges.
The EURO STOXX 50 tracks the Eurozone’s biggest and most traded companies. It also underlies one of the world’s largest ranges of ETFs and mutual funds. As of November 2023, there were €27.3 billion in ETFs and €23.5B in mutual fund assets under management tracking the index.
“For the past 25 years, the EURO STOXX 50 has served as an accurate, reliable and tradable representation of the Eurozone equity market.”
— Axel Lomholt, General Manager at STOXX
Partnering with STOXX to Track the European Stock Market
Are you interested in European equities? STOXX can be a valuable partner:
- Comprehensive, liquid and investable ecosystem
- European heritage, global reach
- Highly sophisticated customization capabilities
- Open architecture approach to using data
- Close partnerships with clients
- Part of ISS STOXX and Deutsche Börse Group
With a full suite of indices, STOXX can help you benchmark against the European stock market.
Learn how STOXX’s European indices offer liquid and effective market access.

-

 Economy2 days ago
Economic Growth Forecasts for G7 and BRICS Countries in 2024
The IMF has released its economic growth forecasts for 2024. How do the G7 and BRICS countries compare?
-

 Markets1 week ago
U.S. Debt Interest Payments Reach $1 Trillion
U.S. debt interest payments have surged past the $1 trillion dollar mark, amid high interest rates and an ever-expanding debt burden.
-

 United States2 weeks ago
Ranked: The Largest U.S. Corporations by Number of Employees
We visualized the top U.S. companies by employees, revealing the massive scale of retailers like Walmart, Target, and Home Depot.
-

 Markets2 weeks ago
The Top 10 States by Real GDP Growth in 2023
This graphic shows the states with the highest real GDP growth rate in 2023, largely propelled by the oil and gas boom.
-

 Markets2 weeks ago
Ranked: The World’s Top Flight Routes, by Revenue
In this graphic, we show the highest earning flight routes globally as air travel continued to rebound in 2023.
-

 Markets3 weeks ago
Ranked: The Most Valuable Housing Markets in America
The U.S. residential real estate market is worth a staggering $47.5 trillion. Here are the most valuable housing markets in the country.


-

 Debt1 week ago
How Debt-to-GDP Ratios Have Changed Since 2000
-
Markets2 weeks ago
Ranked: The World’s Top Flight Routes, by Revenue
-

 Countries2 weeks ago
Population Projections: The World’s 6 Largest Countries in 2075
-
Markets2 weeks ago
The Top 10 States by Real GDP Growth in 2023
-

 Demographics2 weeks ago
The Smallest Gender Wage Gaps in OECD Countries
-

 United States2 weeks ago
Where U.S. Inflation Hit the Hardest in March 2024
-

 Green2 weeks ago
Top Countries By Forest Growth Since 2001
-
United States2 weeks ago
Ranked: The Largest U.S. Corporations by Number of Employees