Investor Education
Visualizing BlackRock’s Top Equity Holdings
Visualizing BlackRock’s Top 25 Equity Holdings
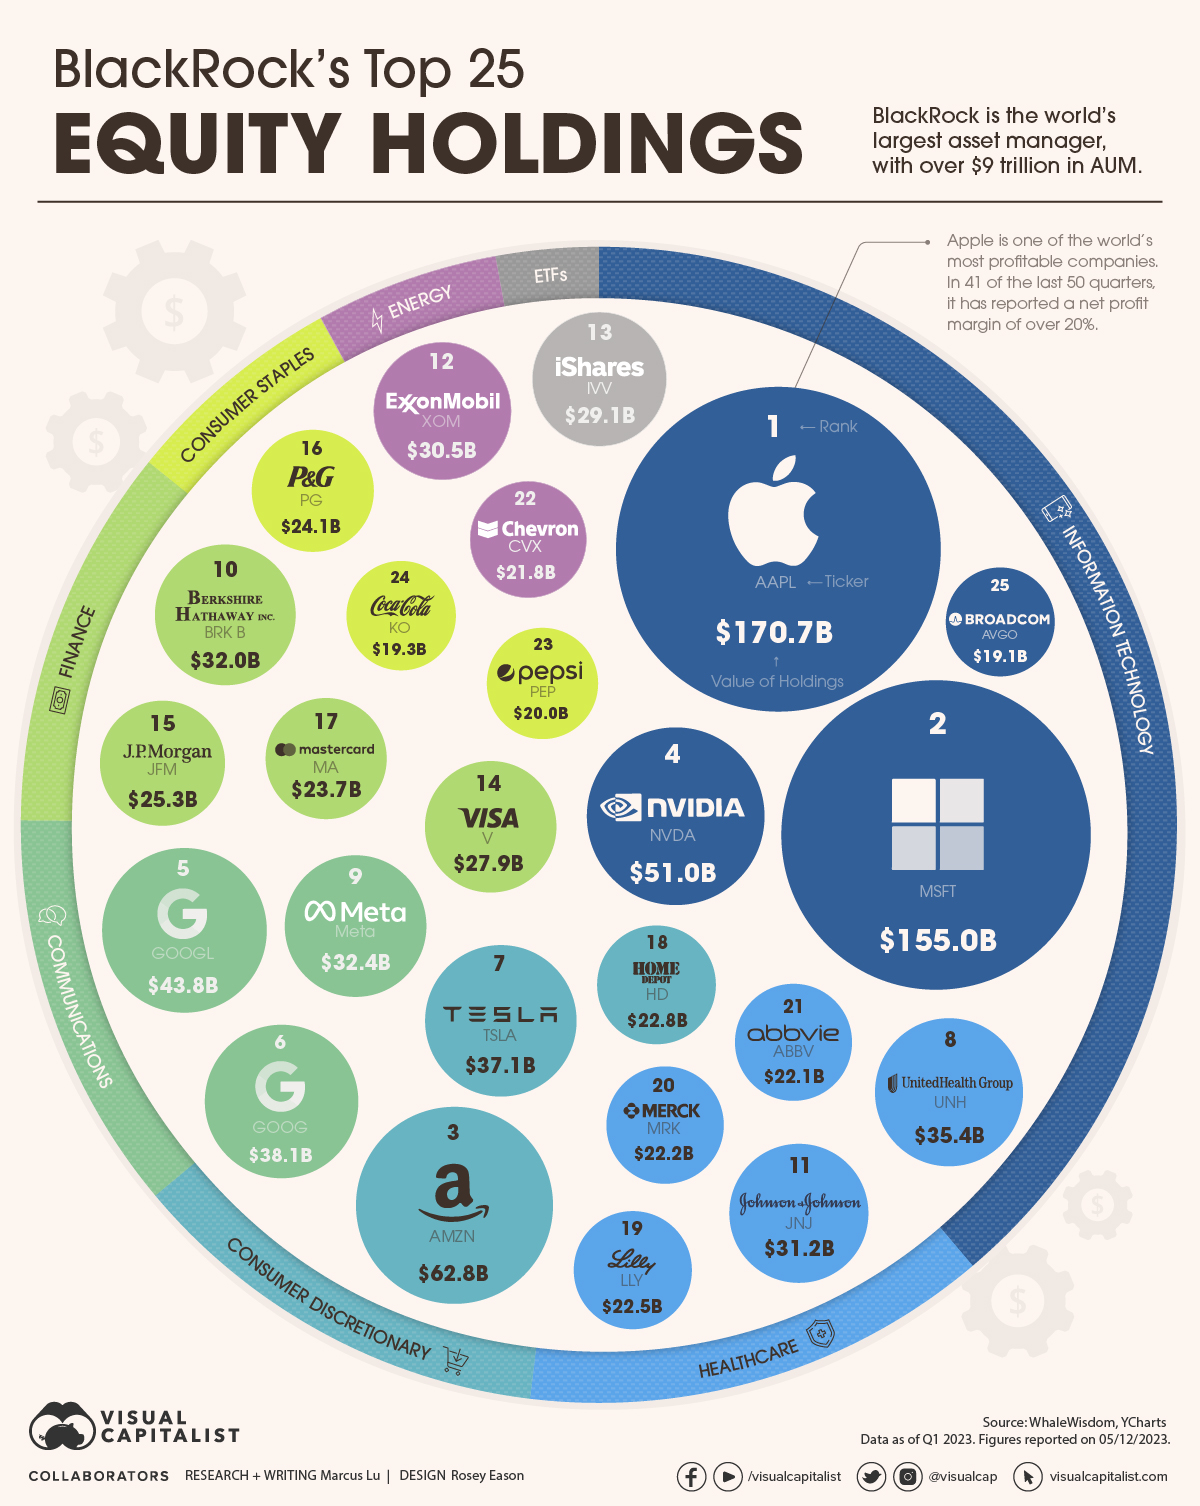
Founded just 34 years ago in 1988, BlackRock has quickly become the world’s largest asset manager with over $9 trillion in assets under management (AUM).
Given this status, BlackRock’s equity portfolio may provide useful insights to investors. To learn more, we’ve visualized the firm’s top 25 equity holdings as of Q1 2023. At that time, these 25 positions were worth over $1 trillion, and they represented about 30% of BlackRock’s overall equity portfolio.
Top 25 Data
The following table shows the data we used to create this infographic. These figures come from BlackRock’s latest 13F filing, which was released on May 12.
| Rank | Name | Sector | Value of Holdings (USD billions) |
|---|---|---|---|
| 1 | Apple | Information Technology | $171 |
| 2 | Microsoft | Information Technology | $155 |
| 3 | Amazon | Consumer Discretionary | $63 |
| 4 | Nvidia | Information Technology | $51 |
| 5 | Google (Class A) | Communications | $44 |
| 6 | Google (Class C) | Communications | $38 |
| 7 | Tesla | Consumer Discretionary | $37 |
| 8 | UnitedHealth Group | Health Care | $35 |
| 9 | Meta | Communications | $32 |
| 10 | Berkshire Hathaway (Class B) | Finance | $32 |
| 11 | Johnson & Johnson | Health Care | $31 |
| 12 | Exxon Mobil | Energy | $30 |
| 13 | iShares Core S&P 500 ETF | ETF | $29 |
| 14 | Visa | Finance | $28 |
| 15 | JPMorgan Chase & Co | Finance | $25 |
| 16 | Procter & Gamble Co | Consumer Staples | $24 |
| 17 | Mastercard | Finance | $24 |
| 18 | Home Depot | Consumer Discretionary | $23 |
| 19 | Eli Lilly And Co | Health Care | $23 |
| 20 | Merck & Co | Health Care | $22 |
| 21 | AbbVie | Health Care | $22 |
| 22 | Chevron | Energy | $22 |
| 23 | PepsiCo | Consumer Staples | $20 |
| 24 | Coca-Cola Co | Consumer Staples | $19 |
| 25 | Broadcom | Information Technology | $19 |
As expected, BlackRock’s top equity holdings include America’s most established tech companies: Apple, Microsoft, Amazon, and Google.
BlackRock also has large positions in Nvidia and Broadcom, which happen to be America’s two largest semiconductor companies. Given Nvidia’s incredible YTD performance (198% as of June 19th), this position has likely grown even bigger.
Altogether, tech stocks make up 39% of this top 25 list. The next biggest sector would be healthcare, at 13% of the total value.
Ownership Stakes
How much of a controlling stake does BlackRock have in these companies? We answer this question in the following table, which again uses Q1 2023 data.
| Name | % Ownership | Quarter 1st Owned |
|---|---|---|
| Merck & Co | 8.24% | Q3 2007 |
| UnitedHealth Group | 8.02% | Q4 2008 |
| Berkshire Hathaway (Class B) | 7.98% | Q3 2007 |
| PepsiCo | 7.96% | Q3 2007 |
| AbbVie | 7.86% | Q1 2013 |
| Home Depot | 7.60% | Q3 2007 |
| Nvidia | 7.44% | Q3 2007 |
| Microsoft | 7.22% | Q3 2007 |
| Coca-Cola Co | 7.20% | Q3 2007 |
| Broadcom | 7.16% | Q3 2009 |
| Google (Class A) | 7.09% | Q3 2007 |
| Chevron | 7.02% | Q3 2007 |
| Eli Lilly And Co | 6.90% | Q3 2007 |
| Mastercard | 6.89% | Q3 2007 |
| Procter & Gamble Co | 6.86% | Q3 2007 |
| Exxon Mobil | 6.83% | Q3 2007 |
| JPMorgan Chase & Co | 6.59% | Q3 2007 |
| Visa | 6.55% | Q2 2008 |
| Apple | 6.54% | Q3 2007 |
| Johnson & Johnson | 6.46% | Q3 2007 |
| Google (Class C) | 6.13% | Q2 2014 |
| Amazon | 5.93% | Q4 2008 |
| Tesla | 5.70% | Q3 2010 |
| Meta | 5.69% | Q2 2012 |
Google’s Class C shares (Ticker: GOOG) do not offer voting rights.
When it comes to shareholder voting, BlackRock has historically voted on behalf of its clients to “advance their long-term economic interests.” Given its massive size, some people believe that BlackRock has too much influence on major corporations.
In 2021, it was reported that BlackRock would begin allowing some institutional clients to cast their own votes at shareholder meetings.


Investor Education
How MSCI Builds Thematic Indexes: A Step-by-Step Guide
From developing an index objective to choosing relevant stocks, this graphic breaks down how MSCI builds thematic indexes using examples.


How MSCI Builds Thematic Indexes: A Step-by-Step Guide
Have you ever wondered how MSCI builds its thematic indexes?
To capture long-term, structural trends that could drive business performance in the future, the company follows a systematic approach. This graphic from MSCI breaks down each step in the process used to create its thematic indexes.
Step 1: Develop an Index Objective
MSCI first builds a broad statement of what the theme aims to capture based on extensive research and insights from industry experts.
Steps 2 and 3: List Sub-Themes, Generate Keyword List
Together with experts, MSCI creates a list of sub-themes or “seedwords” to identify aligned business activities.
The team then assembles a collection of suitable documents describing the theme. Natural language processing efficiently analyzes word frequency and relevance to generate a more detailed set of keywords contextually similar to the seedwords.
Step 4: Find Relevant Companies
By analyzing financial reports, MSCI picks companies relevant to the theme using two methods:
- Direct approach: Revenue from a company’s business segment is considered 100% relevant if the segment name matches a theme keyword. Standard Industrial Classification (SIC) codes from these directly-matched segments make up the eligible SIC code list used in the indirect approach.
- Indirect approach: If a segment name doesn’t match theme keywords, MSCI will:
- Analyze the density of theme keywords mentioned in the company’s description. A minimum of two unique keywords is required.
- The keyword density determines a “discount factor” to reflect lower certainty in theme alignment.
- Revenue from business segments with an eligible SIC code, regardless of how they are named, is scaled down by the discount factor.
The total percentage of revenue applicable to the theme from both approaches determines a company’s relevance score.
Step 5: Select the Stocks
Finally, MSCI narrows down the stocks that will be included:
- Global parent universe: The ACWI Investable Market Index (IMI) is the starting point for standard thematic indexes.
- Relevance filter: The universe is filtered for companies with a relevance score of at least 25%.
- False positive control: Eligible companies that are mapped to un-related GICS sub-industries are removed.
Companies with higher relevance scores and market caps have a higher weighting in the index, with the maximum weighting for any one issuer capped at 5%. The final selected stocks span various sectors.
MSCI Thematic Indexes: Regularly Updated and Rules-Based
Once an index is built, it is reviewed semi-annually and updated based on:
- Changes to the parent index
- Changes at individual companies
- Theme developments based on expert input
Theme keywords are reviewed yearly in May. Overall, MSCI’s thematic index construction process is objective, scalable, and flexible. The process can be customized based on the theme(s) you want to capture.
Learn more about MSCI’s thematic indexes.

-

 Investor Education6 months ago
The 20 Most Common Investing Mistakes, in One Chart
Here are the most common investing mistakes to avoid, from emotionally-driven investing to paying too much in fees.
-

 Investor Education10 months ago
Visualizing BlackRock’s Top Equity Holdings
BlackRock is the world’s largest asset manager, with over $9 trillion in holdings. Here are the company’s top equity holdings.
-

 Investor Education11 months ago
10-Year Annualized Forecasts for Major Asset Classes
This infographic visualizes 10-year annualized forecasts for both equities and fixed income using data from Vanguard.
-

 Investor Education1 year ago
Visualizing 90 Years of Stock and Bond Portfolio Performance
How have investment returns for different portfolio allocations of stocks and bonds compared over the last 90 years?
-

 Investor Education2 years ago
Countries with the Highest Default Risk in 2022
In this infographic, we examine new data that ranks the top 25 countries by their default risk.
-

 Markets2 years ago
The Best Months for Stock Market Gains
This infographic analyzes over 30 years of stock market performance to identify the best and worst months for gains.

-

 Education1 week ago
How Hard Is It to Get Into an Ivy League School?
-

 Technology2 weeks ago
Ranked: Semiconductor Companies by Industry Revenue Share
-

 Markets2 weeks ago
Ranked: The World’s Top Flight Routes, by Revenue
-

 Demographics2 weeks ago
Population Projections: The World’s 6 Largest Countries in 2075
-

 Markets2 weeks ago
The Top 10 States by Real GDP Growth in 2023
-

 Demographics2 weeks ago
The Smallest Gender Wage Gaps in OECD Countries
-

 Economy2 weeks ago
Where U.S. Inflation Hit the Hardest in March 2024
-

 Environment2 weeks ago
Top Countries By Forest Growth Since 2001