A Geographic Breakdown of the MSCI ACWI IMI
The following content is sponsored by MSCI
A Geographic Breakdown of the MSCI ACWI IMI Index
How can investors track stock markets around the world?
Using the MSCI All Countries World Index Investable Market Index (MSCI ACWI IMI), investors can benchmark their portfolios to a comprehensive group of developed and emerging markets. With over $4.2 trillion in assets benchmarked to the ACWI—about 4% of all managed assets globally—the index is widely quoted.
In this graphic from MSCI, we explore a geographic breakdown of the MSCI ACWI IMI index, and how it has changed over time.
What is the MSCI ACWI IMI?
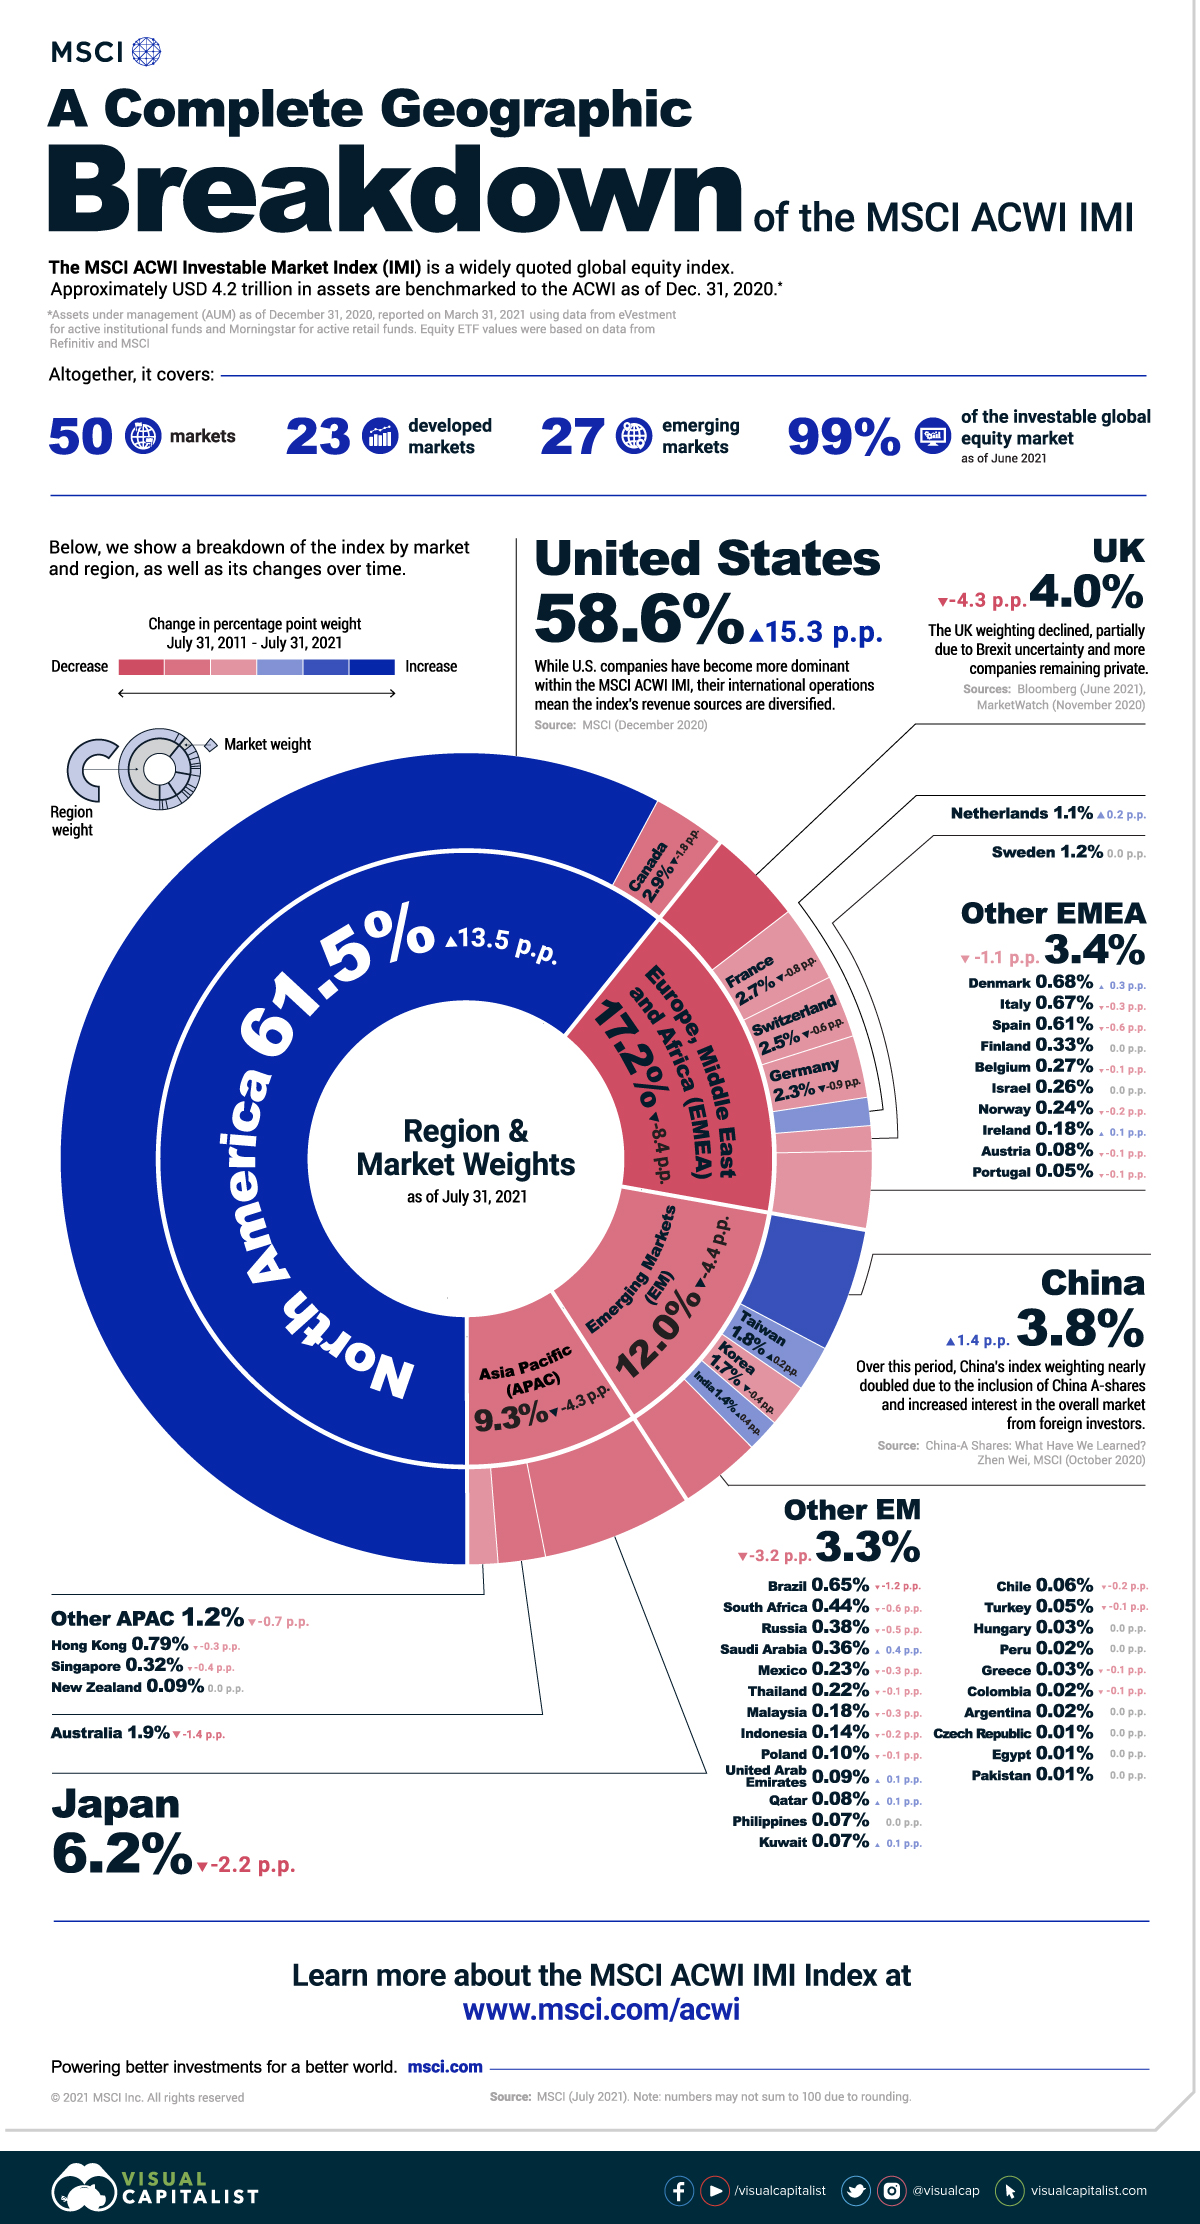
The MSCI ACWI IMI is a leading global equity index. It tracks the performance of a basket of securities that are intended to represent the entire global stock market. Altogether, it covers:
- 9,200 securities
- 23 developed markets
- 27 emerging markets
- 99% of the investable global equity market
Using a standardized approach, the index includes businesses of all sizes from small to large market capitalization.
Market Weights
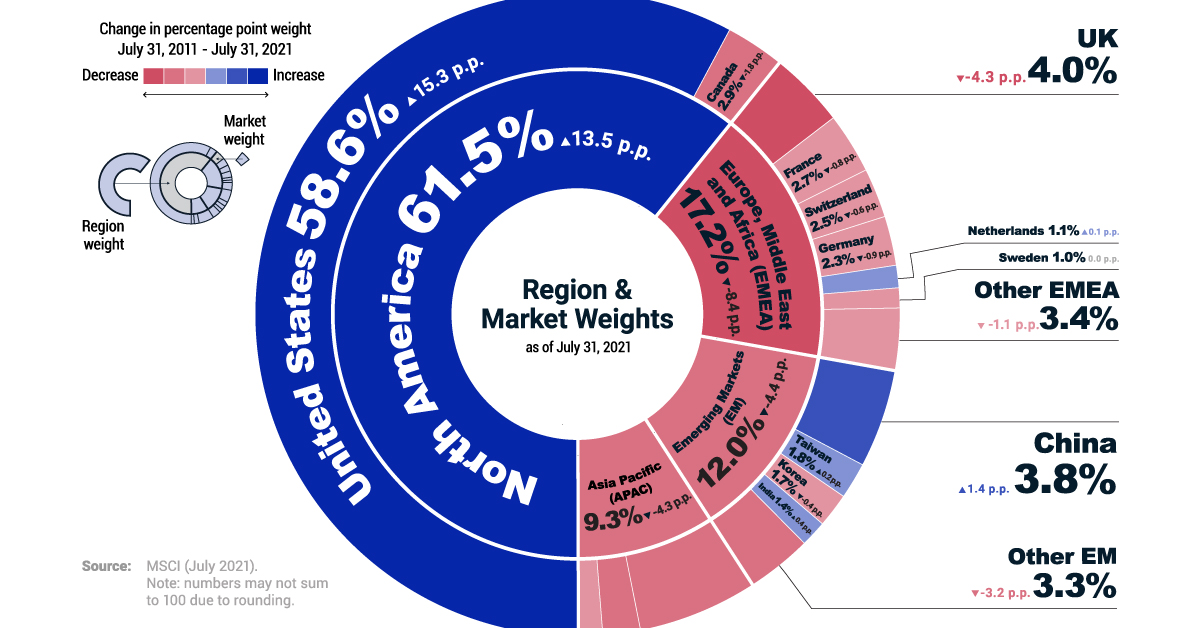
The MSCI ACWI IMI Index is broken down into broad regions and specific markets, such as North America and the U.S. respectively. Below, we show the specific market weights of the index as of July 31, 2011 and July 31, 2021. We also show how much these weights have increased or decreased over the last 10 years.
| Market | Region | 2011 Weight | 2021 Weight | Percentage Point Change |
|---|---|---|---|---|
| Canada | North America | 4.74% | 2.91% | -1.8 p.p. |
| U.S. | North America | 43.34% | 58.61% | 15.3 p.p. |
| Austria | EMEA | 0.16% | 0.08% | -0.1 p.p. |
| Belgium | EMEA | 0.39% | 0.27% | -0.1 p.p. |
| Denmark | EMEA | 0.42% | 0.68% | 0.3 p.p. |
| Finland | EMEA | 0.37% | 0.33% | 0.0 p.p. |
| France | EMEA | 3.50% | 2.73% | -0.8 p.p. |
| Germany | EMEA | 3.24% | 2.31% | -0.9 p.p. |
| Ireland | EMEA | 0.13% | 0.18% | 0.1 p.p. |
| Israel | EMEA | 0.29% | 0.26% | 0.0 p.p. |
| Italy | EMEA | 0.99% | 0.67% | -0.3 p.p. |
| Netherlands | EMEA | 0.92% | 1.11% | 0.2 p.p. |
| Norway | EMEA | 0.42% | 0.24% | -0.2 p.p. |
| Portugal | EMEA | 0.10% | 0.05% | -0.1 p.p. |
| Spain | EMEA | 1.21% | 0.61% | -0.6 p.p. |
| Sweden | EMEA | 1.20% | 1.20% | 0.0 p.p. |
| Switzerland | EMEA | 3.09% | 2.47% | -0.6 p.p. |
| United Kingdom | EMEA | 8.28% | 3.99% | -4.3 p.p. |
| Argentina | EM | 0.00% | 0.02% | 0.0 p.p. |
| Brazil | EM | 1.86% | 0.65% | -1.2 p.p. |
| Chile | EM | 0.21% | 0.06% | -0.2 p.p. |
| China | EM | 2.32% | 3.76% | 1.4 p.p. |
| Colombia | EM | 0.10% | 0.02% | -0.1 p.p. |
| Czech Republic | EM | 0.05% | 0.01% | 0.0 p.p. |
| Egypt | EM | 0.05% | 0.01% | 0.0 p.p. |
| Greece | EM | 0.10% | 0.03% | -0.1 p.p. |
| Hungary | EM | 0.05% | 0.03% | 0.0 p.p. |
| India | EM | 1.01% | 1.40% | 0.4 p.p. |
| Indonesia | EM | 0.39% | 0.14% | -0.2 p.p. |
| Korea | EM | 2.07% | 1.67% | -0.4 p.p. |
| Kuwait | EM | 0.00% | 0.07% | 0.1 p.p. |
| Malaysia | EM | 0.44% | 0.18% | -0.3 p.p. |
| Mexico | EM | 0.55% | 0.23% | -0.3 p.p. |
| Pakistan | EM | 0.00% | 0.01% | 0.0 p.p. |
| Peru | EM | 0.06% | 0.02% | 0.0 p.p. |
| Philippines | EM | 0.09% | 0.07% | 0.0 p.p. |
| Poland | EM | 0.23% | 0.10% | -0.1 p.p. |
| Qatar | EM | 0.00% | 0.08% | 0.1 p.p. |
| Russia | EM | 0.85% | 0.38% | -0.5 p.p. |
| Saudi Arabia | EM | 0.00% | 0.36% | 0.4 p.p. |
| South Africa | EM | 1.00% | 0.44% | -0.6 p.p. |
| Taiwan | EM | 1.63% | 1.85% | 0.2 p.p. |
| Thailand | EM | 0.28% | 0.22% | -0.1 p.p. |
| Turkey | EM | 0.20% | 0.05% | -0.1 p.p. |
| United Arab Emirates | EM | 0.00% | 0.09% | 0.1 p.p. |
| Australia | Asia Pacific | 3.34% | 1.94% | -1.4 p.p. |
| Hong Kong | Asia Pacific | 1.11% | 0.79% | -0.3 p.p. |
| Japan | Asia Pacific | 8.37% | 6.22% | -2.2 p.p. |
| New Zealand | Asia Pacific | 0.07% | 0.09% | 0.0 p.p. |
| Singapore | Asia Pacific | 0.74% | 0.32% | -0.4 p.p. |
Note: numbers may not sum to 100 due to rounding. EM stands for Emerging Markets, and EMEA stands for Europe, Middle East, and Africa.
Over the last decade, the UK’s index weighting has halved. Brexit uncertainty caused British stocks to underperform relative to other markets. In addition, the UK’s public equity marketing has been shrinking, with the number of listed companies falling by 21% in just eight years.
Japan saw its weighting decline by more than two percentage points. The country has faced a very slow recovery since the asset price bubble in 1989, and the stock market has yet to surpass its previous peak.
On the other hand, China’s weighting in the MSCI ACWI IMI has increased over the last 10 years. This is primarily due to two factors:
- China A shares, shares of mainland China based companies that are quoted in the local renminbi currency, were previously only available to domestic investors. China’s market reforms made them more widely accessible to international investors.
- As accessibility and growth increased in the region, foreign investors expressed increased interest in the Chinese market. This drove up demand for the country’s stocks.
Perhaps the biggest takeaway from this data is the increasing dominance of the U.S. stock market, which now makes up almost 60% of the index. What implications does this have on the MSCI ACWI IMI index’s diversification?
Revenue Exposure of the MSCI ACWI IMI
As it turns out, the index is more diversified than it may seem at first glance. American companies have international operations, and earn revenue from many different markets. This makes the revenue exposure of the index much more spread out across each region.
| Region | % of Revenue Exposure |
|---|---|
| EM | 36.4% |
| North America | 31.9% |
| EMEA | 16.7% |
| Asia Pacific | 12.0% |
| Other | 3.1% |
Note: numbers may not sum to 100 due to rounding. Countries included in Other are Bosnia and Herzegovina, Bangladesh, Burkina Faso, Bulgaria, Bahrain, Benin, Botswana, Cote D’Ivoire, Estonia, Ghana, Guinea-Bissau, Croatia, Iceland, Jamaica, Jordan, Kenya, Kazakhstan, Lebanon, Sri Lanka, Lithuania, Morocco, Mali, Mauritius, Niger, Nigeria, Oman, Palestine, Romania, Serbia, Slovenia, Senegal, Togo, Tunisia, Trinidad and Tobago, Ukraine, Vietnam and Zimbabwe.
On a revenue exposure basis, North America—where the U.S. is by far the largest market—has a weighting of just over 30%. Emerging markets take the top spot, making up over a third of the index’s revenue exposure. This presents an opportunity for investors, as these markets are projected to have higher GDP growth compared to North America.
Broad Exposure
For investors looking to capture the world’s stock market performance, the MSCI ACWI IMI can be a good benchmark. The index offers comprehensive and diversified exposure to various markets. Through regular reviews and rebalancing, it also adjusts to market movements. This ensures it continues to accurately reflect the composition of the global stock market over time.
While investors can’t invest in the index itself, they can invest in a product that tracks the index—and be poised to take advantage of opportunities around the globe.
-

 Sponsored3 years ago
More Than Precious: Silver’s Role in the New Energy Era (Part 3 of 3)
Long known as a precious metal, silver in solar and EV technologies will redefine its role and importance to a greener economy.
-
 Sponsored7 years ago
The History and Evolution of the Video Games Market
Everything from Pong to the rise of mobile gaming and AR/VR. Learn about the $100 billion video games market in this giant infographic.
-
 Sponsored8 years ago
The Extraordinary Raw Materials in an iPhone 6s
Over 700 million iPhones have now been sold, but the iPhone would not exist if it were not for the raw materials that make the technology...
-
 Sponsored8 years ago
The Industrial Internet, and How It’s Revolutionizing Mining
The convergence of the global industrial sector with big data and the internet of things, or the Industrial Internet, will revolutionize how mining works.
