Markets
Visualizing India’s Top Companies by Market Capitalization
Visualizing India’s Top Companies by Market Capitalization
India’s stock market valuation hit $4 trillion in 2023 for the first time ever, bringing the world’s fifth-biggest equity market closer to Hong Kong, which is worth around $4.7 trillion.
This graphic, utilizing data from CompaniesMarketCap, showcases India’s top 50 publicly traded companies by market capitalization.
India’s Biggest Companies Worth Over $2 Trillion
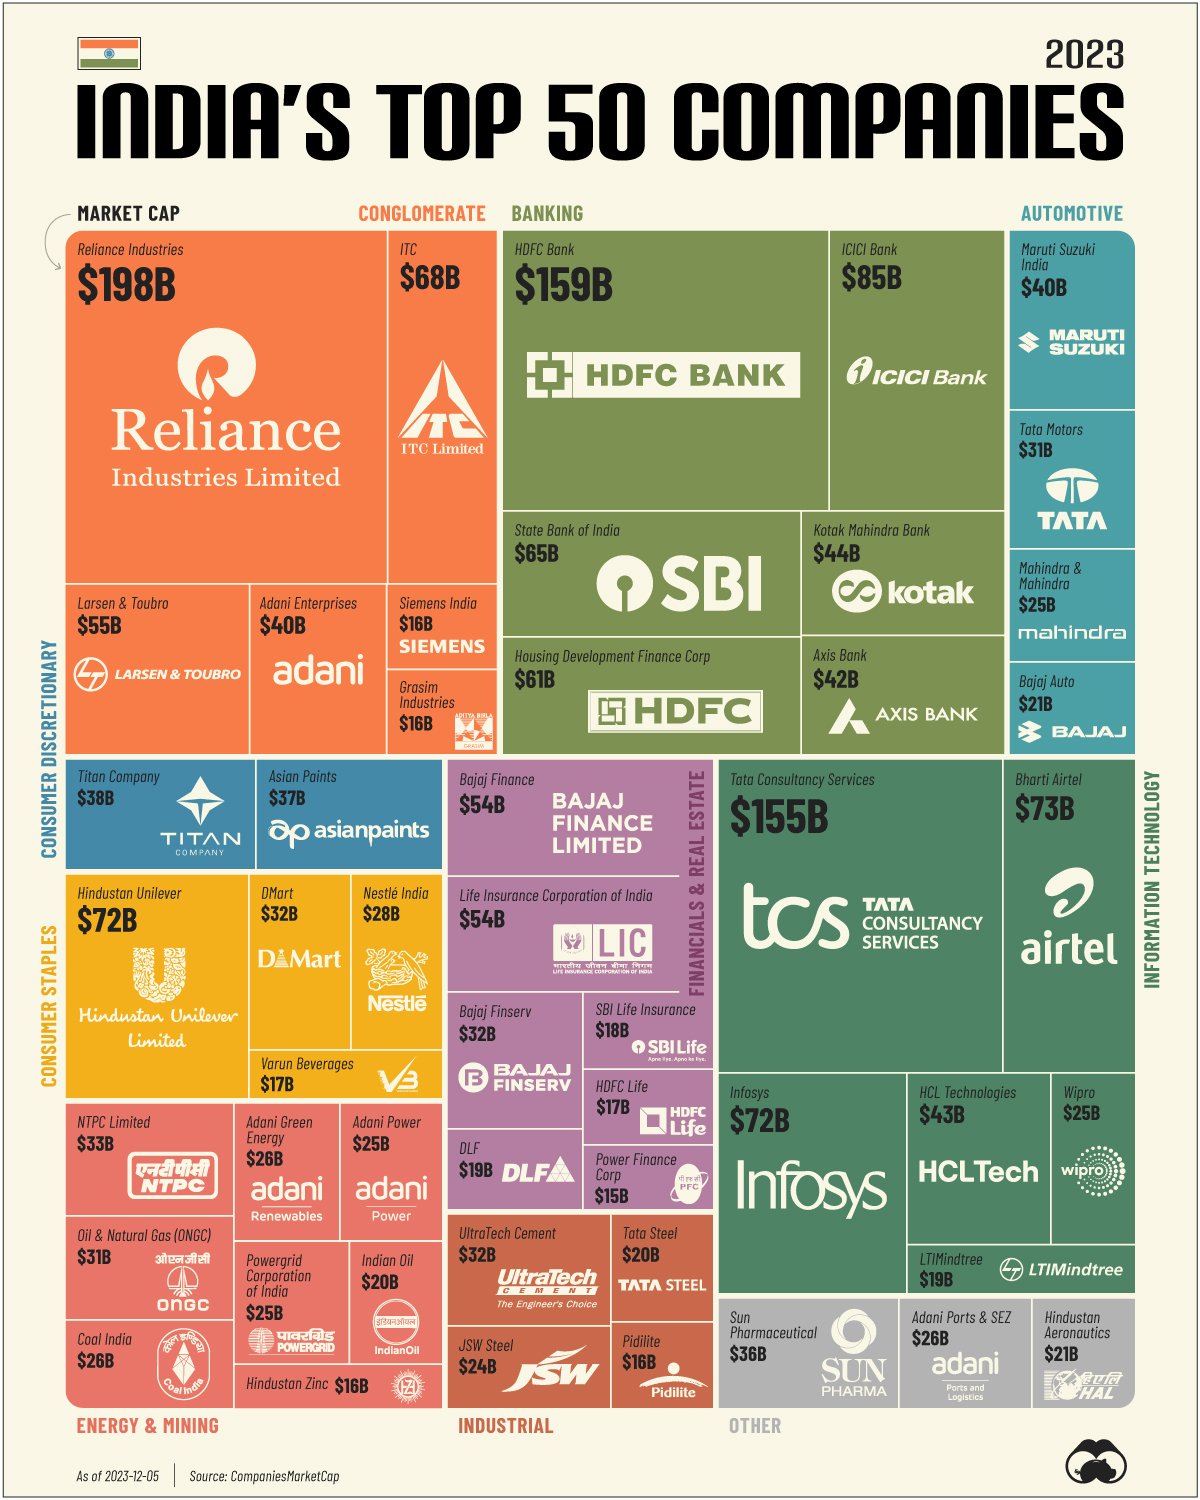
Altogether, the 50 biggest companies in India are worth over $2.1 trillion, or ₹180 trillion in Indian Rupees.
At the top is the multinational conglomerate Reliance Industries. The company operates in diverse sectors, including energy, petrochemicals, natural gas, retail, telecommunications, mass media, and textiles. Additionally, it holds the rank of the 100th largest company worldwide.
Reliance’s Chairman and Managing Director, Mukesh Ambani, is India’s richest person with a net worth of $95.6 billion. The company was founded by his late father Dhirubhai Ambani, a yarn trader, in 1966 as a small textile manufacturer.
| Company | Industry | Market Cap (USD) |
|---|---|---|
| Reliance Industries | Conglomerate | $198 billion |
| HDFC Bank | Banking | $159 billion |
| Tata Consultancy Services | Information Technology | $155 billion |
| ICICI Bank | Banking | $85.4 billion |
| Bharti Airtel | Information Technology | $72.5 billion |
| Hindustan Unilever | Consumer Staples | $72.3 billion |
| Infosys | Information Technology | $72.3 billion |
| ITC | Conglomerate | $67.6 billion |
| State Bank of India | Banking | $65.2 billion |
| Housing Development Finance Corp | Banking | $60.7 billion |
| Larsen & Toubro | Conglomerate | $54.7 billion |
| Bajaj Finance | Financial Services & Real Estate | $54.5 billion |
| Life Insurance Corporation of India | Financial Services & Real Estate | $54.2 billion |
| Kotak Mahindra Bank | Banking | $43.6 billion |
| HCL Technologies | Information Technology | $42.8 billion |
| Axis Bank | Banking | $41.9 billion |
| Adani Enterprises | Conglomerate | $40.5 billion |
| Maruti Suzuki India | Automotive | $40.5 billion |
| Titan Company | Consumer Discretionary | $37.9 billion |
| Asian Paints | Consumer Discretionary | $37.1 billion |
| Sun Pharmaceutical | Other | $35.7 billion |
| NTPC Limited | Energy & Mining | $33.2 billion |
| Bajaj Finserv | Financial Services & Real Estate | $32.3 billion |
| UltraTech Cement | Industrial | $32.3 billion |
| DMart | Consumer Staples | $31.6 billion |
| Tata Motors | Automotive | $31.2 billion |
| Oil & Natural Gas (ONGC) | Energy & Mining | $30.5 billion |
| Nestlé India | Consumer Staples | $28.5 billion |
| Coal India | Energy & Mining | $26.3 billion |
| Adani Ports & SEZ | Other | $26.3 billion |
| Adani Green Energy | Energy & Mining | $25.6 billion |
| Wipro | Information Technology | $25.4 billion |
| Mahindra & Mahindra | Automotive | $25.2 billion |
| Adani Power | Energy & Mining | $24.9 billion |
| Powergrid Corporation of India | Energy & Mining | $24.8 billion |
| JSW Steel | Industrial | $24 billion |
| Bajaj Auto | Automotive | $20.9 billion |
| Hindustan Aeronautics | Other | $20.5 billion |
| Indian Oil | Energy & Mining | $20 billion |
| Tata Steel | Industrial | $19.6 billion |
| LTIMindtree | Information Technology | $19.5 billion |
| DLF | Financial Services & Real Estate | $19.3 billion |
| SBI Life Insurance | Financial Services & Real Estate | $17.6 billion |
| HDFC Life | Financial Services & Real Estate | $17.4 billion |
| Varun Beverages | Consumer Staples | $16.6 billion |
| Hindustan Zinc | Energy & Mining | $16.5 billion |
| Siemens India | Conglomerate | $16.4 billion |
| Grasim Industries | Conglomerate | $16.4 billion |
| Pidilite | Industrial | $15.7 billion |
| Power Finance Corp | Financial Services & Real Estate | $14.9 billion |
In second place is India’s largest private sector bank by assets and the world’s fifth-largest bank by market capitalization, HDFC Bank. The institution employs over 177,000 people.
Furthermore, in third place is IT company Tata Consultancy Services, which provides services in cloud, cognitive business operations, consulting, and cybersecurity in 55 countries, including the U.S., Canada, China, Australia, Germany, and the United Kingdom.
In total, IT comprises six of India’s 50 biggest companies. The list also includes 16 financial and banking groups and spans other sectors such as mining and energy, automotive, and consumer staples.


Markets
The European Stock Market: Attractive Valuations Offer Opportunities
On average, the European stock market has valuations that are nearly 50% lower than U.S. valuations. But how can you access the market?


European Stock Market: Attractive Valuations Offer Opportunities
Europe is known for some established brands, from L’Oréal to Louis Vuitton. However, the European stock market offers additional opportunities that may be lesser known.
The above infographic, sponsored by STOXX, outlines why investors may want to consider European stocks.
Attractive Valuations
Compared to most North American and Asian markets, European stocks offer lower or comparable valuations.
| Index | Price-to-Earnings Ratio | Price-to-Book Ratio |
|---|---|---|
| EURO STOXX 50 | 14.9 | 2.2 |
| STOXX Europe 600 | 14.4 | 2 |
| U.S. | 25.9 | 4.7 |
| Canada | 16.1 | 1.8 |
| Japan | 15.4 | 1.6 |
| Asia Pacific ex. China | 17.1 | 1.8 |
Data as of February 29, 2024. See graphic for full index names. Ratios based on trailing 12 month financials. The price to earnings ratio excludes companies with negative earnings.
On average, European valuations are nearly 50% lower than U.S. valuations, potentially offering an affordable entry point for investors.
Research also shows that lower price ratios have historically led to higher long-term returns.
Market Movements Not Closely Connected
Over the last decade, the European stock market had low-to-moderate correlation with North American and Asian equities.
The below chart shows correlations from February 2014 to February 2024. A value closer to zero indicates low correlation, while a value of one would indicate that two regions are moving in perfect unison.
| EURO STOXX 50 | STOXX EUROPE 600 | U.S. | Canada | Japan | Asia Pacific ex. China |
|
|---|---|---|---|---|---|---|
| EURO STOXX 50 | 1.00 | 0.97 | 0.55 | 0.67 | 0.24 | 0.43 |
| STOXX EUROPE 600 | 1.00 | 0.56 | 0.71 | 0.28 | 0.48 | |
| U.S. | 1.00 | 0.73 | 0.12 | 0.25 | ||
| Canada | 1.00 | 0.22 | 0.40 | |||
| Japan | 1.00 | 0.88 | ||||
| Asia Pacific ex. China | 1.00 |
Data is based on daily USD returns.
European equities had relatively independent market movements from North American and Asian markets. One contributing factor could be the differing sector weights in each market. For instance, technology makes up a quarter of the U.S. market, but health care and industrials dominate the broader European market.
Ultimately, European equities can enhance portfolio diversification and have the potential to mitigate risk for investors.
Tracking the Market
For investors interested in European equities, STOXX offers a variety of flagship indices:
| Index | Description | Market Cap |
|---|---|---|
| STOXX Europe 600 | Pan-regional, broad market | €10.5T |
| STOXX Developed Europe | Pan-regional, broad-market | €9.9T |
| STOXX Europe 600 ESG-X | Pan-regional, broad market, sustainability focus | €9.7T |
| STOXX Europe 50 | Pan-regional, blue-chip | €5.1T |
| EURO STOXX 50 | Eurozone, blue-chip | €3.5T |
Data is as of February 29, 2024. Market cap is free float, which represents the shares that are readily available for public trading on stock exchanges.
The EURO STOXX 50 tracks the Eurozone’s biggest and most traded companies. It also underlies one of the world’s largest ranges of ETFs and mutual funds. As of November 2023, there were €27.3 billion in ETFs and €23.5B in mutual fund assets under management tracking the index.
“For the past 25 years, the EURO STOXX 50 has served as an accurate, reliable and tradable representation of the Eurozone equity market.”
— Axel Lomholt, General Manager at STOXX
Partnering with STOXX to Track the European Stock Market
Are you interested in European equities? STOXX can be a valuable partner:
- Comprehensive, liquid and investable ecosystem
- European heritage, global reach
- Highly sophisticated customization capabilities
- Open architecture approach to using data
- Close partnerships with clients
- Part of ISS STOXX and Deutsche Börse Group
With a full suite of indices, STOXX can help you benchmark against the European stock market.
Learn how STOXX’s European indices offer liquid and effective market access.

-

 Economy2 days ago
Economic Growth Forecasts for G7 and BRICS Countries in 2024
The IMF has released its economic growth forecasts for 2024. How do the G7 and BRICS countries compare?
-

 Markets1 week ago
U.S. Debt Interest Payments Reach $1 Trillion
U.S. debt interest payments have surged past the $1 trillion dollar mark, amid high interest rates and an ever-expanding debt burden.
-

 United States2 weeks ago
Ranked: The Largest U.S. Corporations by Number of Employees
We visualized the top U.S. companies by employees, revealing the massive scale of retailers like Walmart, Target, and Home Depot.
-

 Markets2 weeks ago
The Top 10 States by Real GDP Growth in 2023
This graphic shows the states with the highest real GDP growth rate in 2023, largely propelled by the oil and gas boom.
-

 Markets2 weeks ago
Ranked: The World’s Top Flight Routes, by Revenue
In this graphic, we show the highest earning flight routes globally as air travel continued to rebound in 2023.
-

 Markets2 weeks ago
Ranked: The Most Valuable Housing Markets in America
The U.S. residential real estate market is worth a staggering $47.5 trillion. Here are the most valuable housing markets in the country.

-

 Education1 week ago
How Hard Is It to Get Into an Ivy League School?
-

 Technology2 weeks ago
Ranked: Semiconductor Companies by Industry Revenue Share
-
Markets2 weeks ago
Ranked: The World’s Top Flight Routes, by Revenue
-

 Demographics2 weeks ago
Population Projections: The World’s 6 Largest Countries in 2075
-
Markets2 weeks ago
The Top 10 States by Real GDP Growth in 2023
-

 Demographics2 weeks ago
The Smallest Gender Wage Gaps in OECD Countries
-

 Economy2 weeks ago
Where U.S. Inflation Hit the Hardest in March 2024
-

 Environment2 weeks ago
Top Countries By Forest Growth Since 2001