Markets
The Events that Defined 2023: Visualized
This visual is part of our 2024 Global Forecast Series. For full access to the series, learn more here.
Visualizing the Major Events of 2023
Looking back at 2023, the year was defined by various international geopolitical events while the tech and business world kept a close eye on artificial intelligence’s advances in the first full year of the technology hitting its stride.
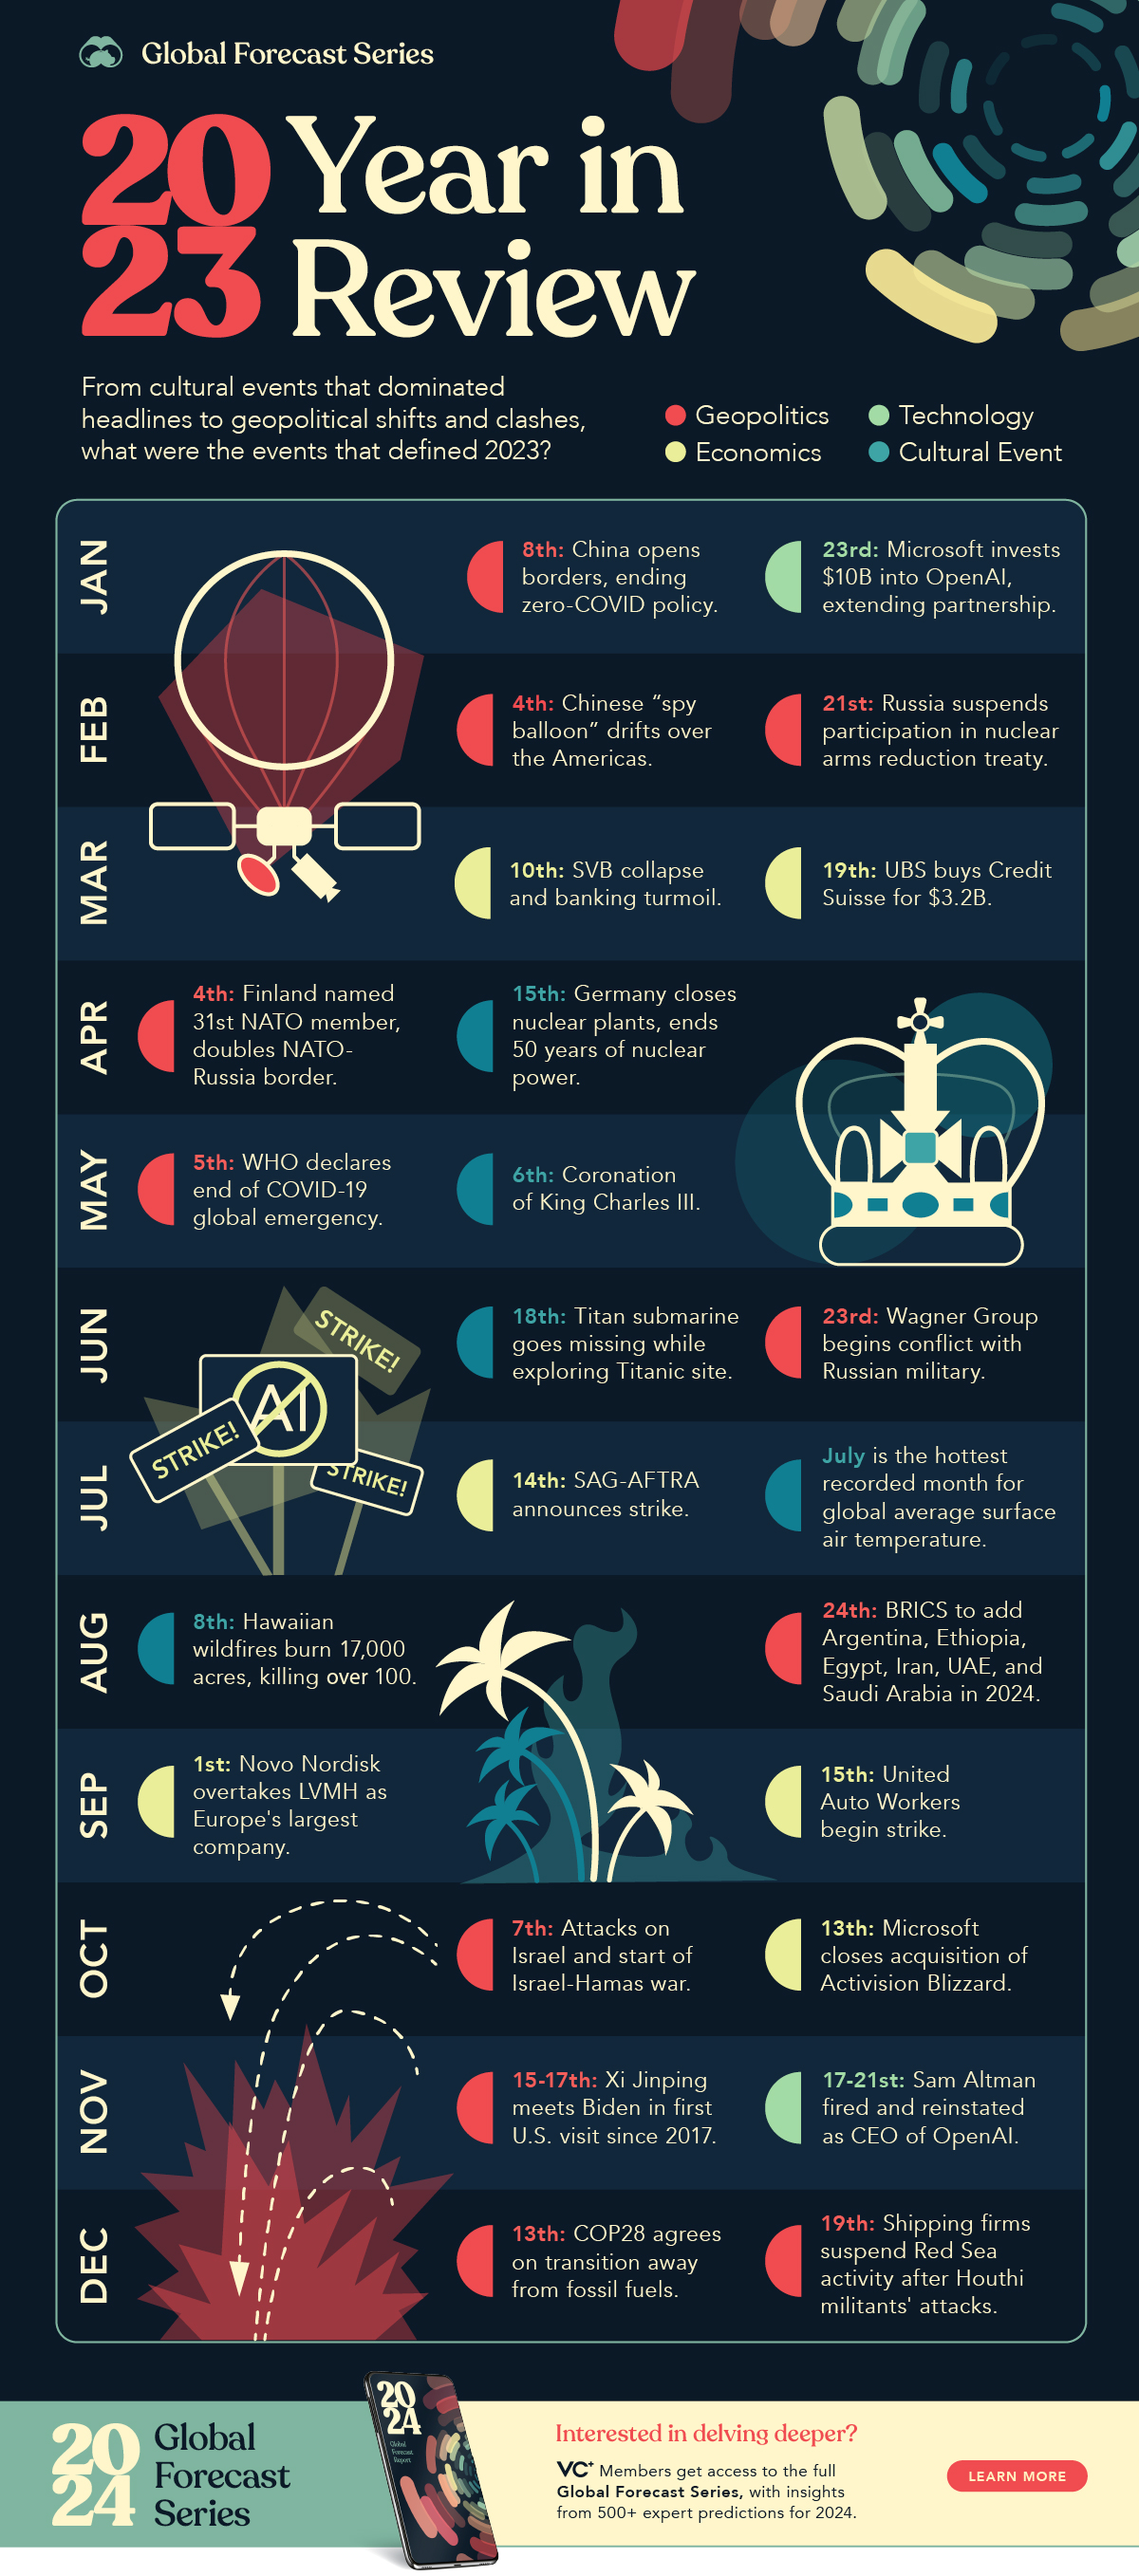
This graphic from our upcoming 2024 Global Forecast Report looks back at the major events that dominated the headlines and captured the world’s attention in 2023.
From the AI tech boom to the various hot and cold conflicts around the world, many of this past year’s pivotal events will have continuing aftershocks and developments to track in 2024.

The Major Geopolitical Events of 2023
Geopolitics were in the spotlight in 2023 after Russia’s invasion of Ukraine shifted global power dynamics and international relations towards a multipolar environment.
As a result, tensions remained high between the U.S. and China throughout the year while various conflicts continued and sprung up in other regions.
China’s COVID Reopening and Spy Balloon Amidst Russia-NATO entrenchment
In the first two months of the year China dominated news headlines as the country reopened its borders and business, ending its highly restrictive zero-COVID measures and policy. The world’s manufacturing powerhouse was one of the last nations to loosen restrictions, and many anticipated it would kickstart the final leg of the world’s post-pandemic recovery.
However, in early February the discovery of what was dubbed a “spy balloon” floating over the U.S. and Canada quickly put China-U.S. relations on edge while Russia also suspended its participation in New START, a nuclear arms reduction treaty that would’ve allowed U.S. and NATO inspections of the country’s nuclear facilities.
Finland’s acceptance into NATO in April then doubled the alliance’s border with Russia, making it a key area to watch in 2024 as a senior Russian diplomat was quoted, saying that in the event of an escalation Finland would be the first to suffer.
BRICS Expansion and Xi Jinping’s Visit to the U.S.
June brought an unexpected internal clash in Russia as the Wagner Group briefly turned against the Russian military, with the mercenary group’s leader Yevgeny Prigozhin dying a couple months later in an airplane crash.
August also brought the BRICS bloc’s announcement of the addition of six new members starting in 2024, marking a key shift in geopolitical relations as the group added major oil producers Saudi Arabia, Iran, and the United Arab Emirates, along with Egypt, Ethiopia, and Argentina.
After nearly a year of further entrenchment in the newly fractured geopolitical landscape, November saw U.S.-China relations thaw as Xi Jinping met with Joe Biden in his first visit to the U.S. since 2017.
Israel-Hamas War and Red Sea Shipping Attacks
While relations between U.S. and China improved in the last quarter of 2023, new conflicts sprung up in other parts of the world.
Hamas’ attacks on Israel on October 7th kicked off Israel’s war against Hamas, which has been followed by Houthi rebel attacks on shipping lines in the Bab el-Mandeb Strait of the Red Sea.
The low-cost drone attacks have resulted in many major shipping firms redirecting their container-ships around all of Africa (extending their journeys by as much as 25%), while the U.S. has grappled with the advent of low-cost drone warfare costing the country millions in missiles as they’ve looked to protect ships in the strait.
Both the Israel-Hamas war and rebel attacks in the Red Sea remain two of the largest question marks around global tensions and affecting supply chains going into 2024.
OpenAI’s Roller Coaster Year
It would be impossible to talk about 2023 without mentioning the roller coaster year OpenAI has had in the spotlight of the AI gold rush.
The year started with Microsoft extending its investment and partnership with OpenAI by $10 billion, as Sam Altman’s company went on to launch its more powerful GPT-4 model along with other key features throughout the year like image recognition, image generation, and deeper custom model instructions with custom GPTs.
While the year seemed to be progressing perfectly for OpenAI at the forefront of the AI hype wave, the end of November saw Sam Altman fired as CEO of the company in one of the most shocking board decisions in recent business history. Sam Altman was reinstated as CEO within 72 hours, giving the tech world just a few days of pause to reflect on the issues of governance and leadership in one of the fastest growing industries.


Markets
The European Stock Market: Attractive Valuations Offer Opportunities
On average, the European stock market has valuations that are nearly 50% lower than U.S. valuations. But how can you access the market?


European Stock Market: Attractive Valuations Offer Opportunities
Europe is known for some established brands, from L’Oréal to Louis Vuitton. However, the European stock market offers additional opportunities that may be lesser known.
The above infographic, sponsored by STOXX, outlines why investors may want to consider European stocks.
Attractive Valuations
Compared to most North American and Asian markets, European stocks offer lower or comparable valuations.
| Index | Price-to-Earnings Ratio | Price-to-Book Ratio |
|---|---|---|
| EURO STOXX 50 | 14.9 | 2.2 |
| STOXX Europe 600 | 14.4 | 2 |
| U.S. | 25.9 | 4.7 |
| Canada | 16.1 | 1.8 |
| Japan | 15.4 | 1.6 |
| Asia Pacific ex. China | 17.1 | 1.8 |
Data as of February 29, 2024. See graphic for full index names. Ratios based on trailing 12 month financials. The price to earnings ratio excludes companies with negative earnings.
On average, European valuations are nearly 50% lower than U.S. valuations, potentially offering an affordable entry point for investors.
Research also shows that lower price ratios have historically led to higher long-term returns.
Market Movements Not Closely Connected
Over the last decade, the European stock market had low-to-moderate correlation with North American and Asian equities.
The below chart shows correlations from February 2014 to February 2024. A value closer to zero indicates low correlation, while a value of one would indicate that two regions are moving in perfect unison.
| EURO STOXX 50 | STOXX EUROPE 600 | U.S. | Canada | Japan | Asia Pacific ex. China |
|
|---|---|---|---|---|---|---|
| EURO STOXX 50 | 1.00 | 0.97 | 0.55 | 0.67 | 0.24 | 0.43 |
| STOXX EUROPE 600 | 1.00 | 0.56 | 0.71 | 0.28 | 0.48 | |
| U.S. | 1.00 | 0.73 | 0.12 | 0.25 | ||
| Canada | 1.00 | 0.22 | 0.40 | |||
| Japan | 1.00 | 0.88 | ||||
| Asia Pacific ex. China | 1.00 |
Data is based on daily USD returns.
European equities had relatively independent market movements from North American and Asian markets. One contributing factor could be the differing sector weights in each market. For instance, technology makes up a quarter of the U.S. market, but health care and industrials dominate the broader European market.
Ultimately, European equities can enhance portfolio diversification and have the potential to mitigate risk for investors.
Tracking the Market
For investors interested in European equities, STOXX offers a variety of flagship indices:
| Index | Description | Market Cap |
|---|---|---|
| STOXX Europe 600 | Pan-regional, broad market | €10.5T |
| STOXX Developed Europe | Pan-regional, broad-market | €9.9T |
| STOXX Europe 600 ESG-X | Pan-regional, broad market, sustainability focus | €9.7T |
| STOXX Europe 50 | Pan-regional, blue-chip | €5.1T |
| EURO STOXX 50 | Eurozone, blue-chip | €3.5T |
Data is as of February 29, 2024. Market cap is free float, which represents the shares that are readily available for public trading on stock exchanges.
The EURO STOXX 50 tracks the Eurozone’s biggest and most traded companies. It also underlies one of the world’s largest ranges of ETFs and mutual funds. As of November 2023, there were €27.3 billion in ETFs and €23.5B in mutual fund assets under management tracking the index.
“For the past 25 years, the EURO STOXX 50 has served as an accurate, reliable and tradable representation of the Eurozone equity market.”
— Axel Lomholt, General Manager at STOXX
Partnering with STOXX to Track the European Stock Market
Are you interested in European equities? STOXX can be a valuable partner:
- Comprehensive, liquid and investable ecosystem
- European heritage, global reach
- Highly sophisticated customization capabilities
- Open architecture approach to using data
- Close partnerships with clients
- Part of ISS STOXX and Deutsche Börse Group
With a full suite of indices, STOXX can help you benchmark against the European stock market.
Learn how STOXX’s European indices offer liquid and effective market access.

-

 Economy2 days ago
Economic Growth Forecasts for G7 and BRICS Countries in 2024
The IMF has released its economic growth forecasts for 2024. How do the G7 and BRICS countries compare?
-

 Markets1 week ago
U.S. Debt Interest Payments Reach $1 Trillion
U.S. debt interest payments have surged past the $1 trillion dollar mark, amid high interest rates and an ever-expanding debt burden.
-

 United States2 weeks ago
Ranked: The Largest U.S. Corporations by Number of Employees
We visualized the top U.S. companies by employees, revealing the massive scale of retailers like Walmart, Target, and Home Depot.
-

 Markets2 weeks ago
The Top 10 States by Real GDP Growth in 2023
This graphic shows the states with the highest real GDP growth rate in 2023, largely propelled by the oil and gas boom.
-

 Markets2 weeks ago
Ranked: The World’s Top Flight Routes, by Revenue
In this graphic, we show the highest earning flight routes globally as air travel continued to rebound in 2023.
-

 Markets2 weeks ago
Ranked: The Most Valuable Housing Markets in America
The U.S. residential real estate market is worth a staggering $47.5 trillion. Here are the most valuable housing markets in the country.


-

 Education1 week ago
How Hard Is It to Get Into an Ivy League School?
-

 Technology2 weeks ago
Ranked: Semiconductor Companies by Industry Revenue Share
-
Markets2 weeks ago
Ranked: The World’s Top Flight Routes, by Revenue
-

 Demographics2 weeks ago
Population Projections: The World’s 6 Largest Countries in 2075
-
Markets2 weeks ago
The Top 10 States by Real GDP Growth in 2023
-

 Demographics2 weeks ago
The Smallest Gender Wage Gaps in OECD Countries
-

 Economy2 weeks ago
Where U.S. Inflation Hit the Hardest in March 2024
-

 Green2 weeks ago
Top Countries By Forest Growth Since 2001