Technology
How Smart is ChatGPT?


Visualizing ChatGPT’s Performance in Human Exams
ChatGPT, a language model developed by OpenAI, has become incredibly popular over the past year due to its ability to generate human-like responses in a wide range of circumstances.
In fact, ChatGPT has become so competent, that students are now using it to help them with their homework. This has prompted several U.S. school districts to block devices from accessing the model while on their networks.
So, how smart is ChatGPT?
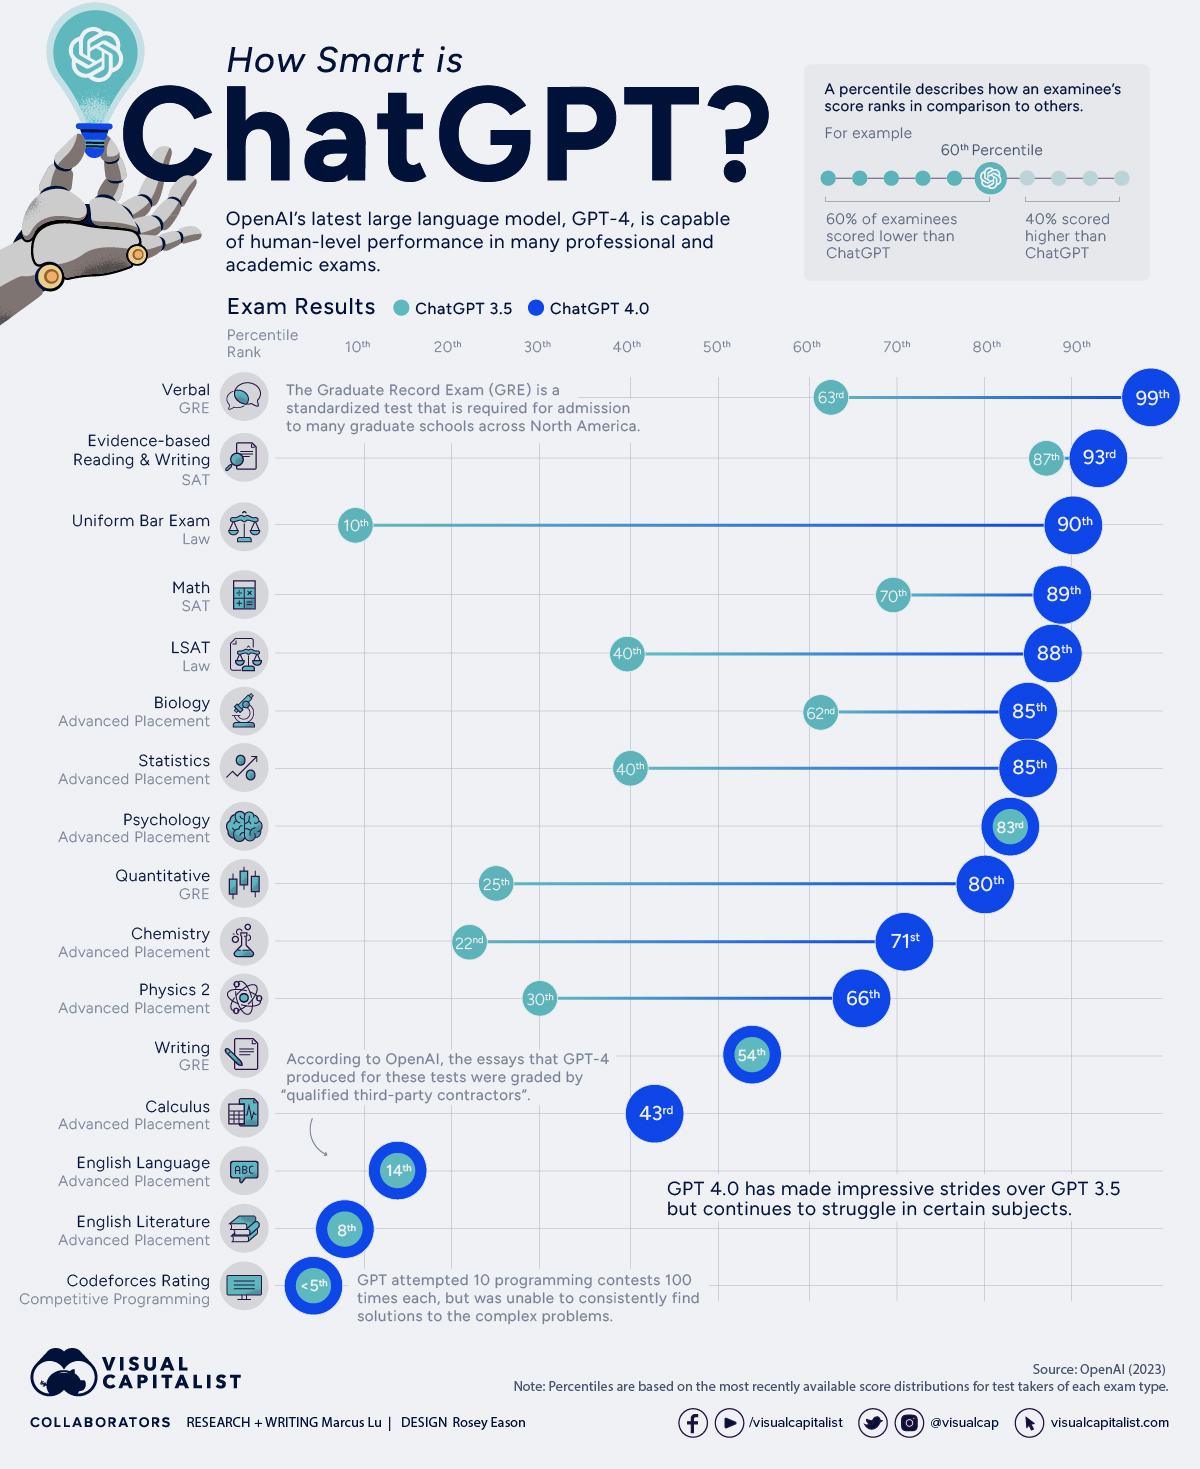
In a technical report released on March 27, 2023, OpenAI provided a comprehensive brief on its most recent model, known as GPT-4. Included in this report were a set of exam results, which we’ve visualized in the graphic above.
GPT-4 vs. GPT-3.5
To benchmark the capabilities of ChatGPT, OpenAI simulated test runs of various professional and academic exams. This includes SATs, the bar examination, and various advanced placement (AP) finals.
Performance was measured in percentiles, which were based on the most recently available score distributions for test takers of each exam type.
Percentile scoring is a way of ranking one’s performance relative to the performance of others. For instance, if you placed in the 60th percentile on a test, this means that you scored higher than 60% of test-takers.
The following table lists the results that we visualized in the graphic.
| Category | Exam | GPT-4 Percentile | GPT-3.5 Percentile |
|---|---|---|---|
| Law | Uniform Bar Exam | 90 | 10 |
| Law | LSAT | 88 | 40 |
| SAT | Evidence-based Reading & Writing | 93 | 87 |
| SAT | Math | 89 | 70 |
| Graduate Record Examination (GRE) | Quantitative | 80 | 25 |
| Graduate Record Examination (GRE) | Verbal | 99 | 63 |
| Graduate Record Examination (GRE) | Writing | 54 | 54 |
| Advanced Placement (AP) | Biology | 85 | 62 |
| Advanced Placement (AP) | Calculus | 43 | 0 |
| Advanced Placement (AP) | Chemistry | 71 | 22 |
| Advanced Placement (AP) | Physics 2 | 66 | 30 |
| Advanced Placement (AP) | Psychology | 83 | 83 |
| Advanced Placement (AP) | Statistics | 85 | 40 |
| Advanced Placement (AP) | English Language | 14 | 14 |
| Advanced Placement (AP) | English Literature | 8 | 8 |
| Competitive Programming | Codeforces Rating | <5 | <5 |
The scores reported above are for GPT-4 with visual inputs enabled. Please see OpenAI’s technical report for more comprehensive results.
As we can see, GPT-4 (released in March 2023) is much more capable than GPT-3.5 (released March 2022) in the majority of these exams. It was, however, unable to improve in AP English and in competitive programming.
Regarding AP English (and other exams where written responses were required), ChatGPT’s submissions were graded by “1-2 qualified third-party contractors with relevant work experience grading those essays”. While ChatGPT is certainly capable of producing adequate essays, it may have struggled to comprehend the exam’s prompts.
For competitive programming, GPT attempted 10 Codeforces contests 100 times each. Codeforces hosts competitive programming contests where participants must solve complex problems. GPT-4’s average Codeforces rating is 392 (below the 5th percentile), while its highest on a single contest was around 1,300. Referencing the Codeforces ratings page, the top-scoring user is jiangly from China with a rating of 3,841.
What’s Changed With GPT-4?
Here are some areas where GPT-4 has improved the user experience over GPT-3.5.
Internet Access and Plugins
A limiting factor with GPT-3.5 was that it didn’t have access to the internet and was only trained on data up to June 2021.
With GPT-4, users will have access to various plugins that empower ChatGPT to access the internet, provide more up to date responses, and complete a wider range of tasks. This includes third-party plugins from services such as Expedia which will enable ChatGPT to book an entire vacation for you.
Visual Inputs
While GPT-3.5 could only accept text inputs, GPT-4 has the ability to also analyze images. Users will be able to ask ChatGPT to describe a photo, analyze a chart, or even explain a meme.
Greater Context Length
Lastly, GPT-4 is able to handle much larger amounts of text and keep conversations going for longer. For reference, GPT-3.5 had a max request value of 4,096 tokens, which is equivalent to roughly 3,000 words. GPT-4 has two variants, one with 8,192 tokens (6,000 words) and another with 32,768 tokens (24,000 words).
 |
Interested in learning more about the impact artificial intelligence is having on the world of work? VC+ members have access to this special dispatch as well as our entire archive of VC+ content. Find out more. |


Technology
All of the Grants Given by the U.S. CHIPS Act
Intel, TSMC, and more have received billions in subsidies from the U.S. CHIPS Act in 2024.


All of the Grants Given by the U.S. CHIPS Act
This was originally posted on our Voronoi app. Download the app for free on iOS or Android and discover incredible data-driven charts from a variety of trusted sources.
This visualization shows which companies are receiving grants from the U.S. CHIPS Act, as of April 25, 2024. The CHIPS Act is a federal statute signed into law by President Joe Biden that authorizes $280 billion in new funding to boost domestic research and manufacturing of semiconductors.
The grant amounts visualized in this graphic are intended to accelerate the production of semiconductor fabrication plants (fabs) across the United States.
Data and Company Highlights
The figures we used to create this graphic were collected from a variety of public news sources. The Semiconductor Industry Association (SIA) also maintains a tracker for CHIPS Act recipients, though at the time of writing it does not have the latest details for Micron.
| Company | Federal Grant Amount | Anticipated Investment From Company |
|---|---|---|
| 🇺🇸 Intel | $8,500,000,000 | $100,000,000,000 |
| 🇹🇼 TSMC | $6,600,000,000 | $65,000,000,000 |
| 🇰🇷 Samsung | $6,400,000,000 | $45,000,000,000 |
| 🇺🇸 Micron | $6,100,000,000 | $50,000,000,000 |
| 🇺🇸 GlobalFoundries | $1,500,000,000 | $12,000,000,000 |
| 🇺🇸 Microchip | $162,000,000 | N/A |
| 🇬🇧 BAE Systems | $35,000,000 | N/A |
BAE Systems was not included in the graphic due to size limitations
Intel’s Massive Plans
Intel is receiving the largest share of the pie, with $8.5 billion in grants (plus an additional $11 billion in government loans). This grant accounts for 22% of the CHIPS Act’s total subsidies for chip production.
From Intel’s side, the company is expected to invest $100 billion to construct new fabs in Arizona and Ohio, while modernizing and/or expanding existing fabs in Oregon and New Mexico. Intel could also claim another $25 billion in credits through the U.S. Treasury Department’s Investment Tax Credit.
TSMC Expands its U.S. Presence
TSMC, the world’s largest semiconductor foundry company, is receiving a hefty $6.6 billion to construct a new chip plant with three fabs in Arizona. The Taiwanese chipmaker is expected to invest $65 billion into the project.
The plant’s first fab will be up and running in the first half of 2025, leveraging 4 nm (nanometer) technology. According to TrendForce, the other fabs will produce chips on more advanced 3 nm and 2 nm processes.
The Latest Grant Goes to Micron
Micron, the only U.S.-based manufacturer of memory chips, is set to receive $6.1 billion in grants to support its plans of investing $50 billion through 2030. This investment will be used to construct new fabs in Idaho and New York.

-

 Education1 week ago
How Hard Is It to Get Into an Ivy League School?
-

 Technology2 weeks ago
Ranked: Semiconductor Companies by Industry Revenue Share
-

 Markets2 weeks ago
Ranked: The World’s Top Flight Routes, by Revenue
-

 Demographics2 weeks ago
Population Projections: The World’s 6 Largest Countries in 2075
-

 Markets2 weeks ago
The Top 10 States by Real GDP Growth in 2023
-

 Demographics2 weeks ago
The Smallest Gender Wage Gaps in OECD Countries
-

 Economy2 weeks ago
Where U.S. Inflation Hit the Hardest in March 2024
-

 Green2 weeks ago
Top Countries By Forest Growth Since 2001