Technology
Visualizing Global Attitudes Towards AI
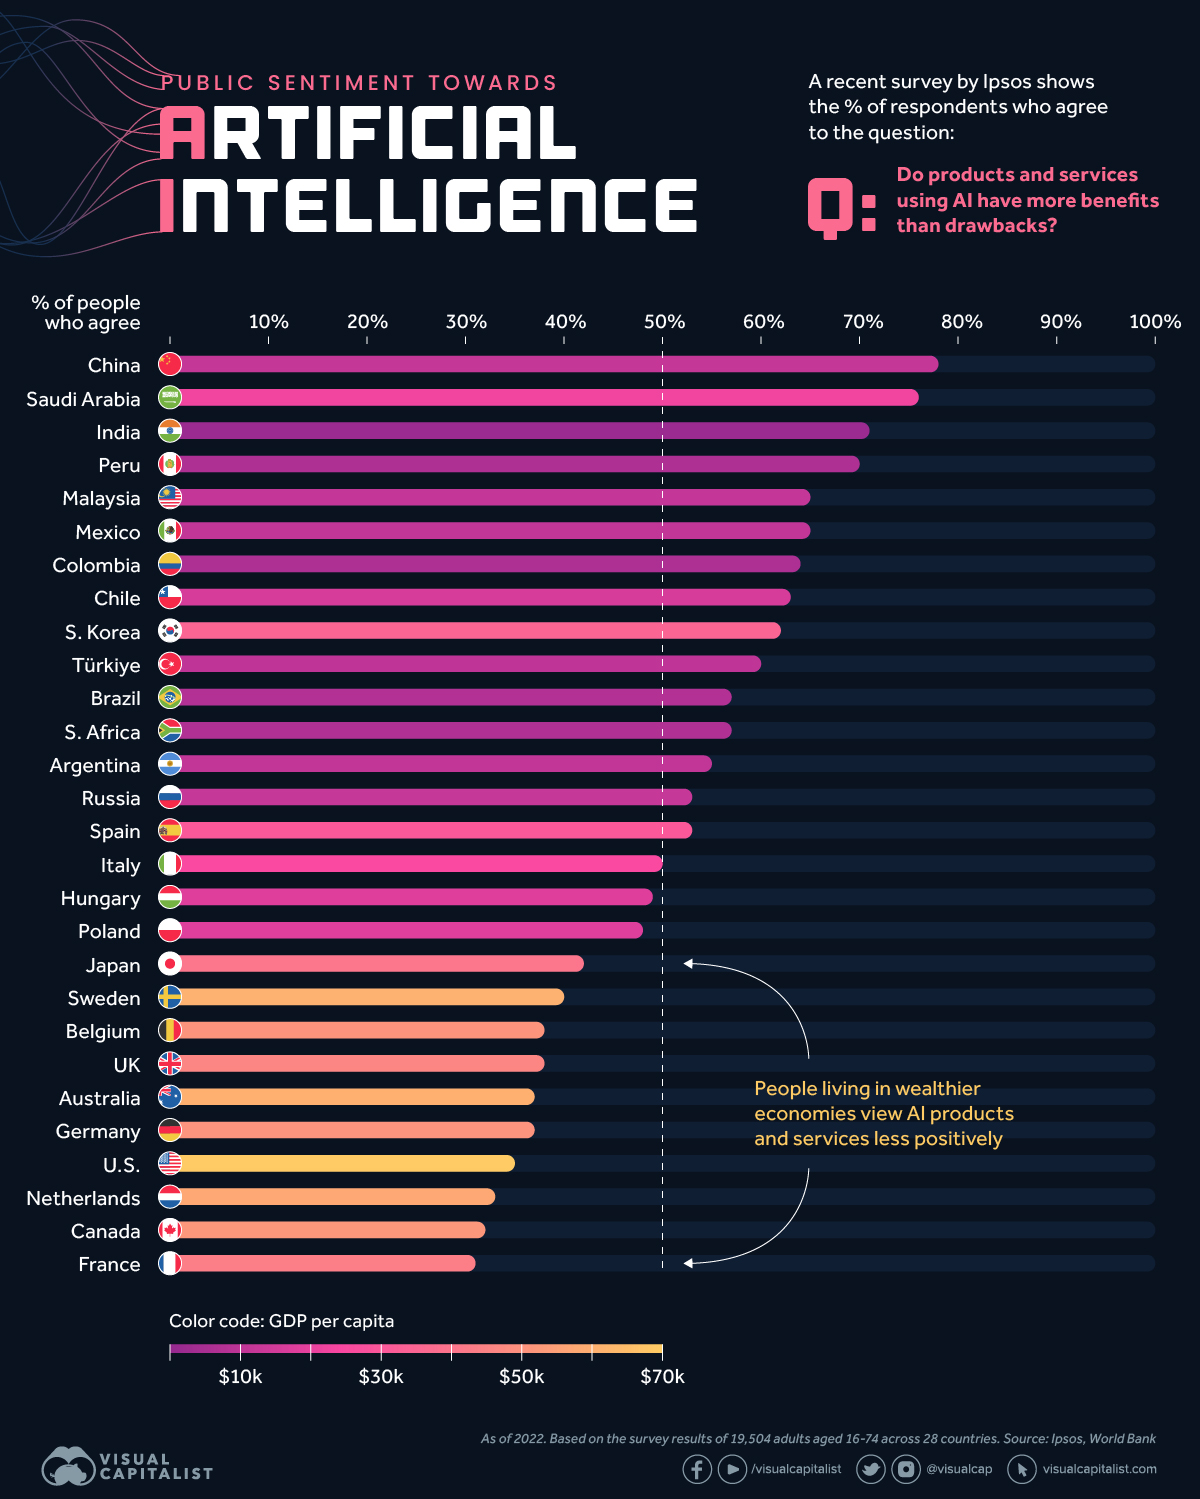


Comparing Public Sentiment Towards AI, by Country
Artificial intelligence (AI) is one of the fastest growing and most disruptive technologies in the world today. Because it has the potential to drastically impact society, it’s important to measure how people are feeling towards it.
This infographic visualizes survey data from market research firm, Ipsos, to see how attitudes towards AI varies by country. By including each country’s GDP per capita, we can see that wealthier populations are more skeptical about products and services that use the technology.
Data and Methodology
This data is based on a 28-country survey of 19,504 adults aged 18 to 74. Polling took place between November and December 2021, and the results were published in January 2022.
This survey took place before the recent explosion in popularity of generative AI tools such as ChatGPT, DALL-E, and Midjourney, but forms the foundation for how people view this rapidly improving technology.
The table below lists the percentage of respondents who agreed with the following statement:
“Products and services using artificial intelligence have more benefits than drawbacks”
| Country | % Agreeing With Statement | GDP per capita |
|---|---|---|
| China | 78% | $12,556 |
| Saudi Arabia | 76% | $23,186 |
| India | 71% | $2,257 |
| Peru | 70% | $6,622 |
| Malaysia | 65% | $11,109 |
| Mexico | 65% | $10,046 |
| Colombia | 64% | $6,104 |
| Chile | 63% | $16,265 |
| South Korea | 62% | $34,998 |
| Türkiye | 60% | $9,661 |
| Brazil | 57% | $7,507 |
| South Africa | 57% | $7,055 |
| Argentina | 55% | $10,636 |
| Russia | 53% | $12,195 |
| Spain | 53% | $30,104 |
| Italy | 50% | $35,658 |
| Hungary | 49% | $18,728 |
| Poland | 48% | $18,000 |
| Japan | 42% | $39,313 |
| Sweden | 40% | $61,029 |
| Belgium | 38% | $51,247 |
| UK | 38% | $46,510 |
| Australia | 37% | $60,443 |
| Germany | 37% | $51,203 |
| United States | 35% | $70,249 |
| Netherlands | 33% | $57,768 |
| Canada | 32% | $51,988 |
| France | 31% | $43,659 |
GDP per capita as of 2021. Source: World Bank
Ipsos notes that their samples from developing economies like China and India were “more urban, more educated, and more affluent than the general population”. Thus, the results for these countries likely reflect the more tech-savvy segments of their population.
Further Survey Results
Respondents were asked additional questions about AI, which we’ve included in the tables below. Let’s start with this statement:
“Products and services using artificial intelligence make my life easier”
| Country | % Agreeing With Statement | GDP per capita |
|---|---|---|
| China | 87% | $12,556 |
| Saudi Arabia | 80% | $23,186 |
| Peru | 74% | $6,622 |
| South Korea | 74% | $34,998 |
| Mexico | 73% | $10,046 |
| India | 72% | $2,257 |
| Colombia | 71% | $6,104 |
| Malaysia | 71% | $11,109 |
| Türkiye | 71% | $9,661 |
| Chile | 70% | $16,265 |
| South Africa | 67% | $7,055 |
| Brazil | 65% | $7,507 |
| Russia | 64% | $12,195 |
| Argentina | 59% | $10,636 |
| Spain | 59% | $30,104 |
| Poland | 58% | $18,000 |
| Italy | 54% | $35,658 |
| Japan | 52% | $39,313 |
| Hungary | 50% | $18,728 |
| Belgium | 49% | $51,247 |
| Netherlands | 47% | $57,768 |
| Australia | 46% | $60,443 |
| Sweden | 46% | $61,029 |
| Germany | 45% | $51,203 |
| UK | 45% | $46,510 |
| Canada | 44% | $51,988 |
| United States | 41% | $70,249 |
| France | 39% | $43,659 |
As expected, we see a similar trend as in the previous question’s results. It seems that developing countries are embracing AI to greater lengths.
Next, we’ll look at a more forward-looking statement:
“Products and services using AI will profoundly change my daily life in the next 3-5 years”.
| Country | % Agreeing With Statement | GDP per capita |
|---|---|---|
| China | 80% | $12,556 |
| Saudi Arabia | 80% | $23,186 |
| South Korea | 76% | $34,998 |
| India | 74% | $2,257 |
| Türkiye | 73% | $9,661 |
| South Africa | 72% | $7,055 |
| Malaysia | 71% | $11,109 |
| Peru | 71% | $6,622 |
| Chile | 67% | $16,265 |
| Colombia | 65% | $6,104 |
| Mexico | 65% | $10,046 |
| Brazil | 61% | $7,507 |
| Argentina | 60% | $10,636 |
| Russia | 60% | $12,195 |
| Poland | 56% | $18,000 |
| Spain | 56% | $30,104 |
| Hungary | 55% | $18,728 |
| Italy | 53% | $35,658 |
| Japan | 53% | $39,313 |
| Netherlands | 53% | $57,768 |
| Belgium | 52% | $51,247 |
| Australia | 50% | $60,443 |
| Sweden | 50% | $61,029 |
| UK | 46% | $46,510 |
| United States | 46% | $70,249 |
| France | 45% | $43,659 |
| Canada | 44% | $51,988 |
| Germany | 44% | $51,203 |
Once again, populations from wealthier countries are at the lower end of the results. This could be due to societal factors (differing attitudes towards technology), economic structure, or some combination of both.
To elaborate on economic structure, let’s look at the world’s two biggest economies, the U.S. and China. The following table shows the distribution of each country’s workforce across the three major sectors.
| Economic Sector | U.S. | China |
|---|---|---|
| Agriculture | 1% | 25% |
| Industry | 20% | 28% |
| Services | 79% | 47% |
As of 2019. Source: Statista
Developing economies such as China have a larger proportion of agricultural and industrial employment, while advanced economies like the U.S. are typically more services oriented. Structural differences such as these could have an impact on how a population views AI.


Technology
All of the Grants Given by the U.S. CHIPS Act
Intel, TSMC, and more have received billions in subsidies from the U.S. CHIPS Act in 2024.


All of the Grants Given by the U.S. CHIPS Act
This was originally posted on our Voronoi app. Download the app for free on iOS or Android and discover incredible data-driven charts from a variety of trusted sources.
This visualization shows which companies are receiving grants from the U.S. CHIPS Act, as of April 25, 2024. The CHIPS Act is a federal statute signed into law by President Joe Biden that authorizes $280 billion in new funding to boost domestic research and manufacturing of semiconductors.
The grant amounts visualized in this graphic are intended to accelerate the production of semiconductor fabrication plants (fabs) across the United States.
Data and Company Highlights
The figures we used to create this graphic were collected from a variety of public news sources. The Semiconductor Industry Association (SIA) also maintains a tracker for CHIPS Act recipients, though at the time of writing it does not have the latest details for Micron.
| Company | Federal Grant Amount | Anticipated Investment From Company |
|---|---|---|
| 🇺🇸 Intel | $8,500,000,000 | $100,000,000,000 |
| 🇹🇼 TSMC | $6,600,000,000 | $65,000,000,000 |
| 🇰🇷 Samsung | $6,400,000,000 | $45,000,000,000 |
| 🇺🇸 Micron | $6,100,000,000 | $50,000,000,000 |
| 🇺🇸 GlobalFoundries | $1,500,000,000 | $12,000,000,000 |
| 🇺🇸 Microchip | $162,000,000 | N/A |
| 🇬🇧 BAE Systems | $35,000,000 | N/A |
BAE Systems was not included in the graphic due to size limitations
Intel’s Massive Plans
Intel is receiving the largest share of the pie, with $8.5 billion in grants (plus an additional $11 billion in government loans). This grant accounts for 22% of the CHIPS Act’s total subsidies for chip production.
From Intel’s side, the company is expected to invest $100 billion to construct new fabs in Arizona and Ohio, while modernizing and/or expanding existing fabs in Oregon and New Mexico. Intel could also claim another $25 billion in credits through the U.S. Treasury Department’s Investment Tax Credit.
TSMC Expands its U.S. Presence
TSMC, the world’s largest semiconductor foundry company, is receiving a hefty $6.6 billion to construct a new chip plant with three fabs in Arizona. The Taiwanese chipmaker is expected to invest $65 billion into the project.
The plant’s first fab will be up and running in the first half of 2025, leveraging 4 nm (nanometer) technology. According to TrendForce, the other fabs will produce chips on more advanced 3 nm and 2 nm processes.
The Latest Grant Goes to Micron
Micron, the only U.S.-based manufacturer of memory chips, is set to receive $6.1 billion in grants to support its plans of investing $50 billion through 2030. This investment will be used to construct new fabs in Idaho and New York.

-

 Debt1 week ago
How Debt-to-GDP Ratios Have Changed Since 2000
-

 Markets2 weeks ago
Ranked: The World’s Top Flight Routes, by Revenue
-

 Countries2 weeks ago
Population Projections: The World’s 6 Largest Countries in 2075
-

 Markets2 weeks ago
The Top 10 States by Real GDP Growth in 2023
-

 Demographics2 weeks ago
The Smallest Gender Wage Gaps in OECD Countries
-

 United States2 weeks ago
Where U.S. Inflation Hit the Hardest in March 2024
-

 Green2 weeks ago
Top Countries By Forest Growth Since 2001
-

 United States2 weeks ago
Ranked: The Largest U.S. Corporations by Number of Employees