Technology
Visualizing Nvidia’s Revenue, by Product Line (2019-2024)
![]() See this visualization first on the Voronoi app.
See this visualization first on the Voronoi app.
Visualizing Nvidia’s Revenue, by Product Line (2019-2024)
This was originally posted on our Voronoi app. Download the app for free on iOS or Android and discover incredible data-driven charts from a variety of trusted sources.
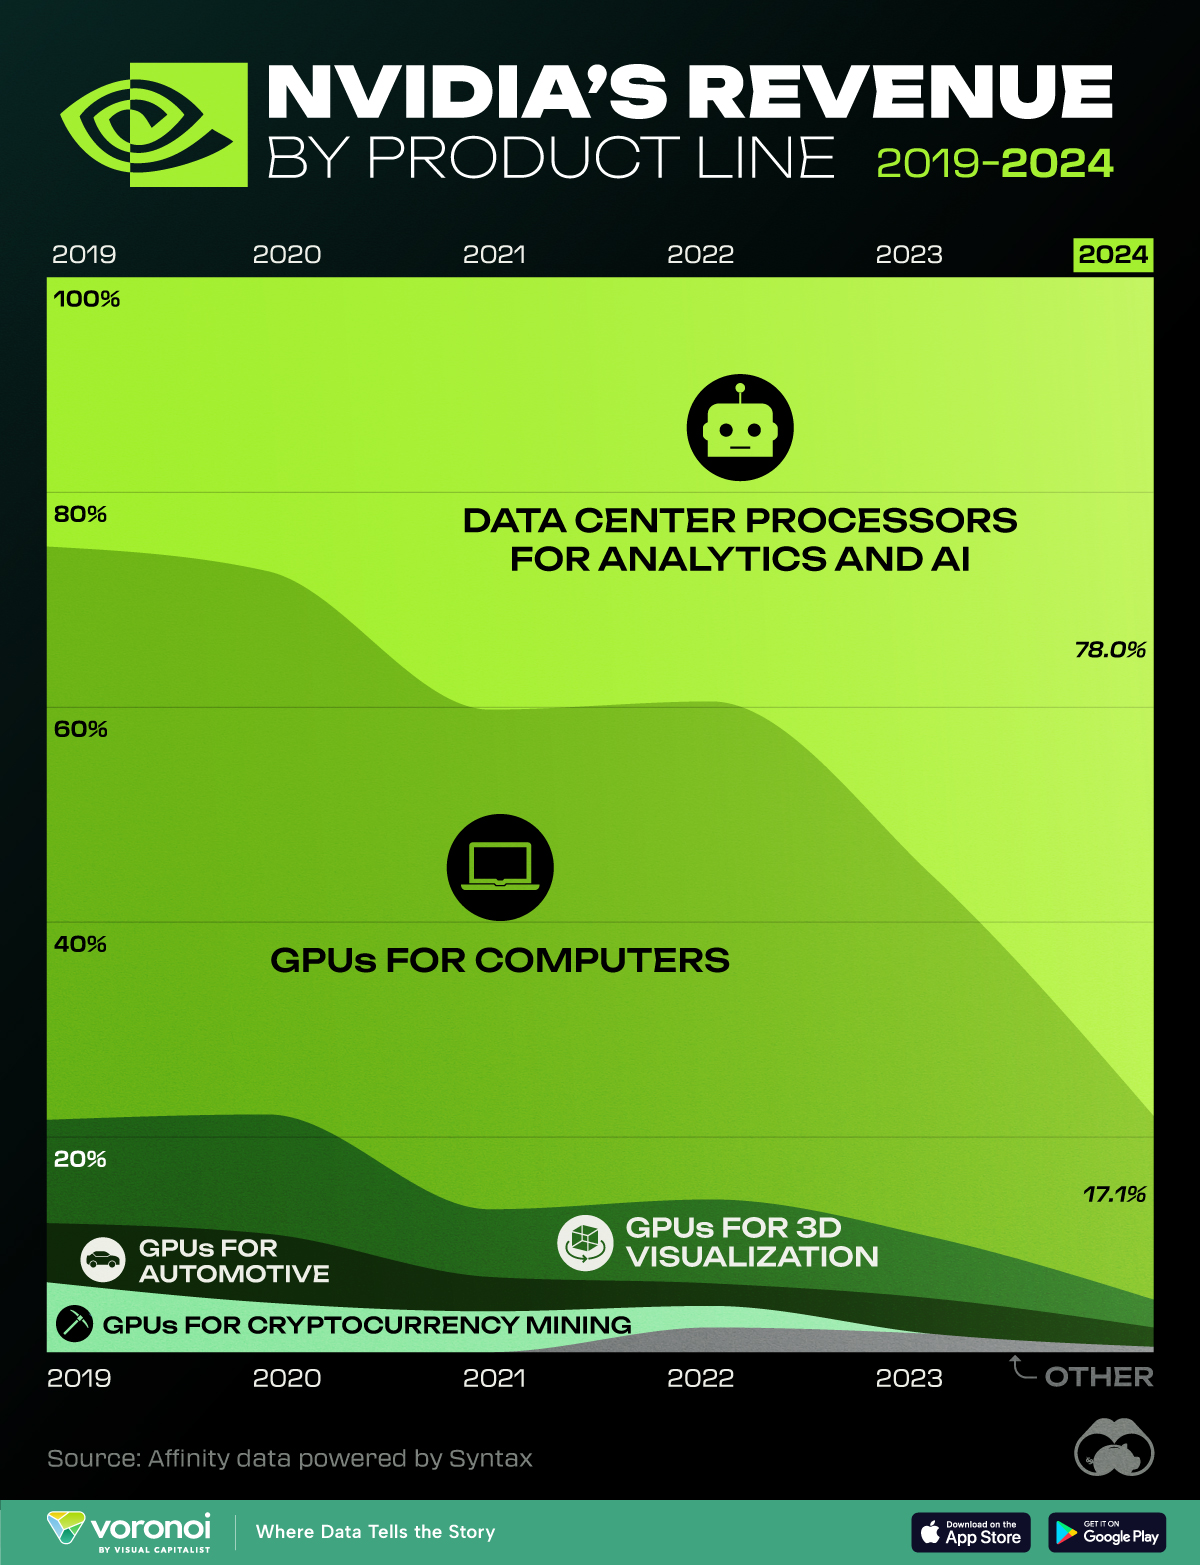
Since the AI boom, the key drivers of Nvidia’s revenue have shifted significantly.
Today, data center processors for analytics and AI have quickly become Nvidia’s largest source of revenue, surpassing the company’s historical main business line of GPUs (graphic processing units). Given the surging demand for hardware that drives AI models, Nvidia’s revenues reached $22.1 billion in the last quarter—a 265% jump from the year before.
This graphic breaks down Nvidia’s revenue by product line, based on Affinity data powered by Syntax.
A Closer Look at Nvidia’s Revenue Sources
Here are the five main revenue channels for America’s largest chipmaker:
| Product Line | 2024 | 2023 | 2022 | 2021 | 2020 | 2019 |
|---|---|---|---|---|---|---|
| Data Center Processors for Analytics and AI | 78.0% | 55.6% | 39.4% | 40.2% | 27.3% | 25.0% |
| GPUs for Computers | 17.1% | 33.6% | 46.3% | 46.5% | 50.5% | 53.3% |
| GPUs for 3D Visualization | 2.6% | 5.7% | 7.8% | 6.3% | 11.1% | 9.6% |
| GPUs for Automotive | 1.8% | 3.3% | 2.1% | 3.2% | 6.4% | 5.5% |
| GPUs for Cryptocurrency Mining | 0.0% | 0.0% | 2.0% | 3.8% | 4.6% | 6.5% |
| Other | 0.5% | 1.7% | 2.3% | 0.0% | 0.0% | 0.0% |
Nvidia’s data center business has witnessed explosive growth, accelerating 409% compared to the fourth quarter of last year.
The analytics and AI unit includes H100 graphics cards that power AI systems, each made up of 80 billion transistors that allow it to compute vast amounts of data used in training large language models. Big tech companies are spending billions on these graphic cards in order to power their computing infrastructure. Meta, for instance, plans to use 350,000 H100 graphics cards in 2024 alone.
The next biggest source of revenue are GPUs for computers, making up 17.1% of total revenues. Nvidia played a key role in developing these specialized chips which are an important component in PCs. Together, these two product lines make up 95.1% of Nvidia’s revenues, while GPUs for 3D visualization and automotive generate only a fraction of all revenues.
Looking ahead, Nvidia’s graphics chips will likely make up a greater share of revenues as demand continues to grow. In fact, the company recently stated that its facing challenges in keeping up with demand and that it is working to allocate chips fairly across customers, prioritizing those that are able to put them to use immediately.


Technology
All of the Grants Given by the U.S. CHIPS Act
Intel, TSMC, and more have received billions in subsidies from the U.S. CHIPS Act in 2024.


All of the Grants Given by the U.S. CHIPS Act
This was originally posted on our Voronoi app. Download the app for free on iOS or Android and discover incredible data-driven charts from a variety of trusted sources.
This visualization shows which companies are receiving grants from the U.S. CHIPS Act, as of April 25, 2024. The CHIPS Act is a federal statute signed into law by President Joe Biden that authorizes $280 billion in new funding to boost domestic research and manufacturing of semiconductors.
The grant amounts visualized in this graphic are intended to accelerate the production of semiconductor fabrication plants (fabs) across the United States.
Data and Company Highlights
The figures we used to create this graphic were collected from a variety of public news sources. The Semiconductor Industry Association (SIA) also maintains a tracker for CHIPS Act recipients, though at the time of writing it does not have the latest details for Micron.
| Company | Federal Grant Amount | Anticipated Investment From Company |
|---|---|---|
| 🇺🇸 Intel | $8,500,000,000 | $100,000,000,000 |
| 🇹🇼 TSMC | $6,600,000,000 | $65,000,000,000 |
| 🇰🇷 Samsung | $6,400,000,000 | $45,000,000,000 |
| 🇺🇸 Micron | $6,100,000,000 | $50,000,000,000 |
| 🇺🇸 GlobalFoundries | $1,500,000,000 | $12,000,000,000 |
| 🇺🇸 Microchip | $162,000,000 | N/A |
| 🇬🇧 BAE Systems | $35,000,000 | N/A |
BAE Systems was not included in the graphic due to size limitations
Intel’s Massive Plans
Intel is receiving the largest share of the pie, with $8.5 billion in grants (plus an additional $11 billion in government loans). This grant accounts for 22% of the CHIPS Act’s total subsidies for chip production.
From Intel’s side, the company is expected to invest $100 billion to construct new fabs in Arizona and Ohio, while modernizing and/or expanding existing fabs in Oregon and New Mexico. Intel could also claim another $25 billion in credits through the U.S. Treasury Department’s Investment Tax Credit.
TSMC Expands its U.S. Presence
TSMC, the world’s largest semiconductor foundry company, is receiving a hefty $6.6 billion to construct a new chip plant with three fabs in Arizona. The Taiwanese chipmaker is expected to invest $65 billion into the project.
The plant’s first fab will be up and running in the first half of 2025, leveraging 4 nm (nanometer) technology. According to TrendForce, the other fabs will produce chips on more advanced 3 nm and 2 nm processes.
The Latest Grant Goes to Micron
Micron, the only U.S.-based manufacturer of memory chips, is set to receive $6.1 billion in grants to support its plans of investing $50 billion through 2030. This investment will be used to construct new fabs in Idaho and New York.

-

 Demographics6 days ago
The Countries That Have Become Sadder Since 2010
-

 Green2 weeks ago
Ranked: The Countries With the Most Air Pollution in 2023
-

 Green2 weeks ago
Ranking the Top 15 Countries by Carbon Tax Revenue
-

 Markets2 weeks ago
U.S. Debt Interest Payments Reach $1 Trillion
-

 Mining2 weeks ago
Gold vs. S&P 500: Which Has Grown More Over Five Years?
-

 Energy2 weeks ago
The World’s Biggest Nuclear Energy Producers
-

 Misc2 weeks ago
How Hard Is It to Get Into an Ivy League School?
-

 Debt2 weeks ago
How Debt-to-GDP Ratios Have Changed Since 2000