Wealth
Ranked: The World’s Top 50 Endowment Funds


Ranked: The World’s Top 50 Endowment Funds
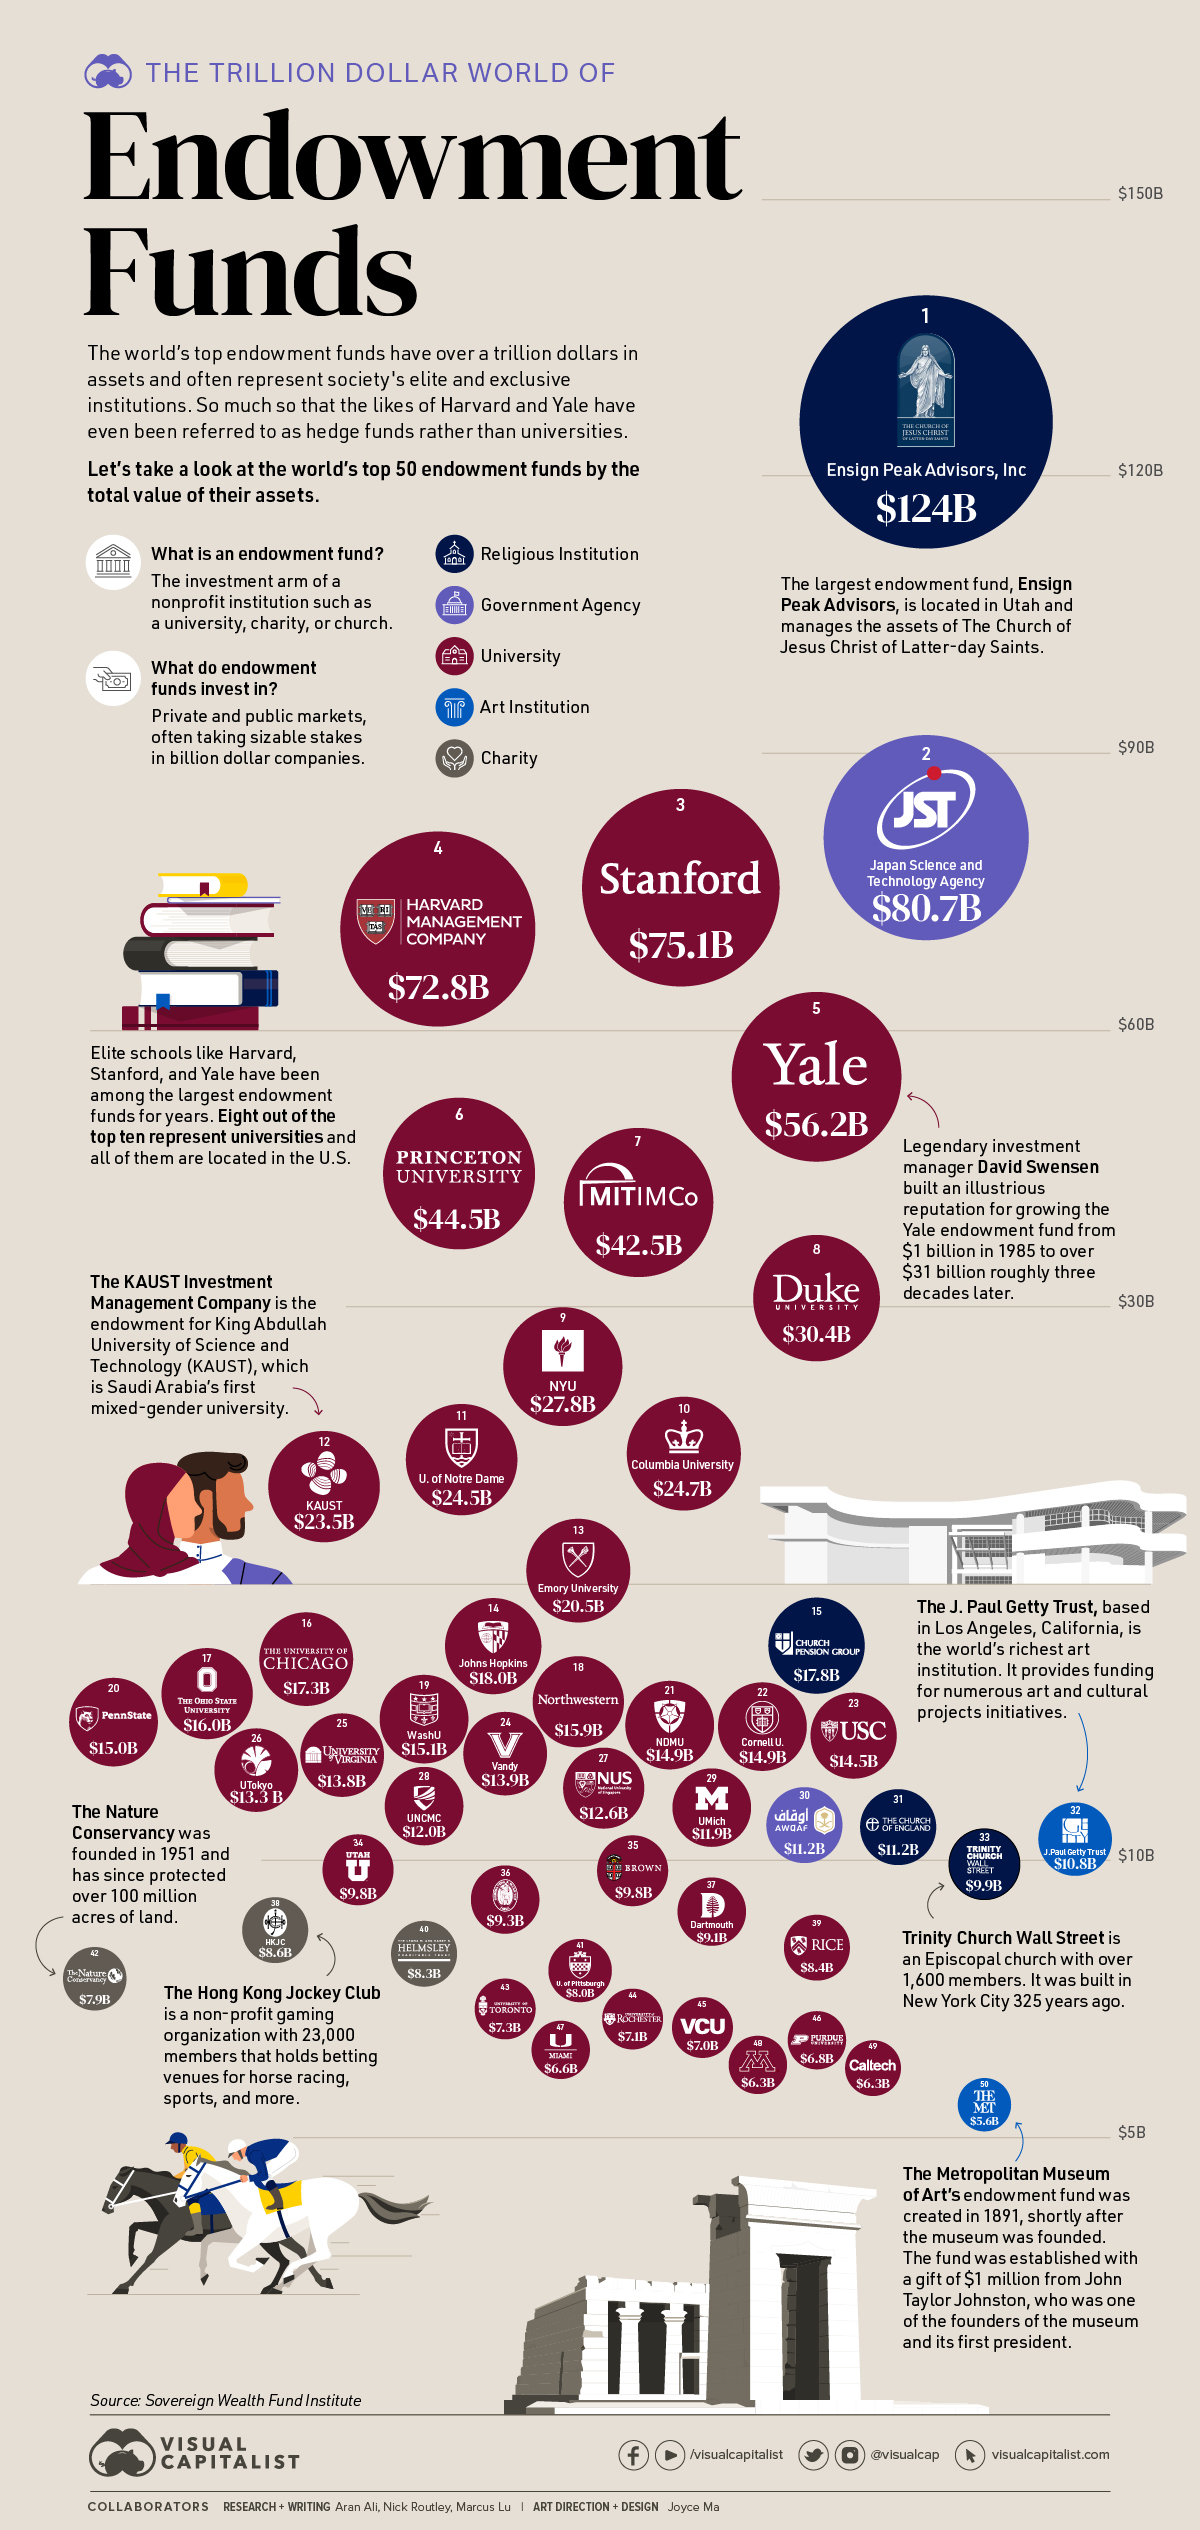
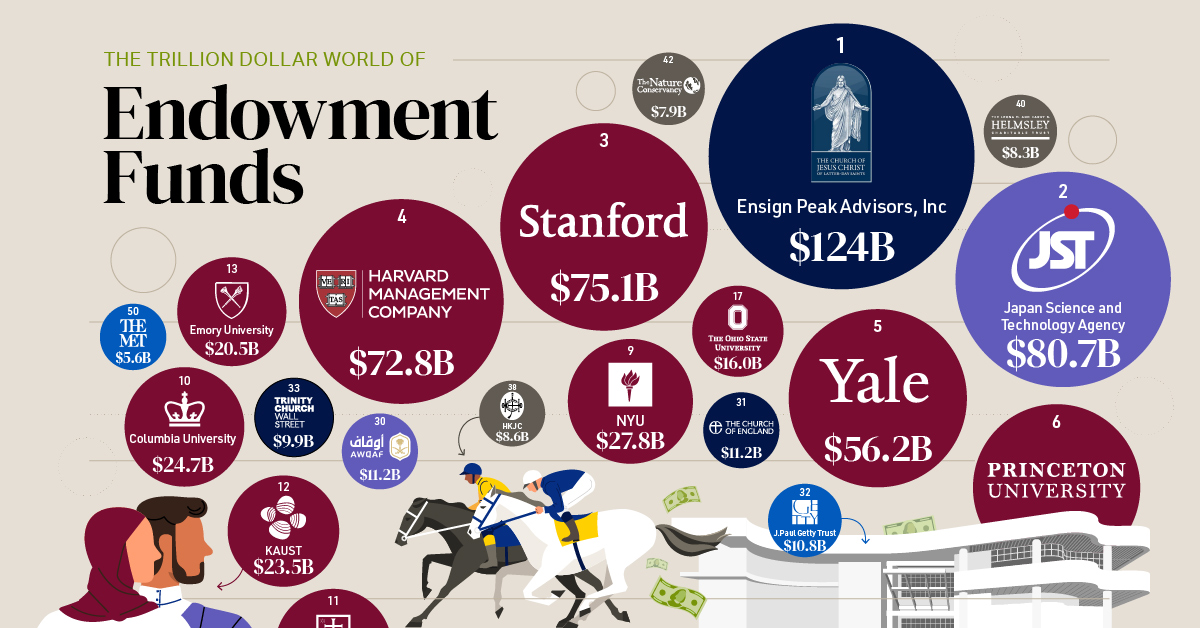
What do Harvard, the Church Commissioners for England, the NYC Metropolitan Museum of Art, and an entity on behalf of Saudi Arabia’s King Abdullah all have in common? They all have endowment funds.
An endowment fund is the investment arm of nonprofit institutions like universities, charities, and churches. The purpose of the fund is to invest the organization’s assets to fuel future operations and other important projects.
The world’s largest endowment funds have billions in investable assets, making them sizable players in the finance sector. Here, using data from Sovereign Wealth Fund Institute, we take a closer look at the world’s largest endowment funds by total assets.
Types of Endowment Funds
Overall, there are four main types of endowment structures.
- Unrestricted Endowment: A fund structure where assets are used at the full discretion of the institution
- Term Endowment: A fund structure with a fixed term time period before the principal can be spent
- Quasi Endowment: A donation to an endowment with a specific purpose to deploy that capital
- Restricted Endowment: A fund structure where the principal value from donations is held forever and only returns generated on the principal can be used
In addition, each endowment fund has different structures in regards to withdrawals, use of funds, and their general investment philosophy.
The Largest Endowment Funds
The largest endowment funds can be compared on a grand economic scale, in terms of assets.
To put it all into perspective, the largest 50 endowment funds represent over a trillion dollars in assets. Or for a more singular example, look at Harvard’s fund, which has an endowment greater than the entire GDP of countries like Serbia, Bolivia, or Slovenia.
Here’s how the top 50 rank.
| Rank | Endowment Fund | Total Assets | Region |
|---|---|---|---|
| 1 | Ensign Peak Advisors, Inc | $124,000,000,000 | North America |
| 2 | Japan Science and Technology Agency | $80,700,000,000 | Asia |
| 3 | Stanford University | $75,143,751,000 | North America |
| 4 | Harvard Management Company | $72,781,329,000 | North America |
| 5 | Yale University | $56,223,259,000 | North America |
| 6 | Princeton University | $44,460,038,000 | North America |
| 7 | MIT Investment Management Company | $42,526,492,000 | North America |
| 8 | Duke University | $30,385,835,000 | North America |
| 9 | New York University | $27,840,535,000 | North America |
| 10 | Columbia University in the City of New York | $24,698,782,000 | North America |
| 11 | University of Notre Dame | $24,599,541,000 | North America |
| 12 | KAUST Investment Management Company | $23,500,000,000 | Middle East |
| 13 | Emory University | $20,458,905,000 | North America |
| 14 | Johns Hopkins University | $18,037,751,000 | North America |
| 15 | Church Pension Fund | $17,773,649,171 | North America |
| 16 | University of Chicago | $17,276,136,000 | North America |
| 17 | Ohio State University | $16,006,851,000 | North America |
| 18 | Northwestern University | $15,855,683,000 | North America |
| 19 | Washington University in St Louis | $15,103,569,000 | North America |
| 20 | Penn State University, Office of Investment Management | $15,017,272,000 | North America |
| 21 | Notre Dame of Maryland University | $14,938,580,253 | North America |
| 22 | Cornell University | $14,850,618,000 | North America |
| 23 | University of Southern California | $14,495,427,000 | North America |
| 24 | Vanderbilt University | $13,883,495,000 | North America |
| 25 | University of Virginia Investment Management Compnay | $13,811,076,000 | North America |
| 26 | University of Tokyo | $13,285,270,000 | Asia |
| 27 | National University of Singapore | $12,626,100,000 | Asia |
| 28 | UNC Management Company | $11,986,857,000 | North America |
| 29 | University of Michigan Office of Investments | $11,900,000,000 | North America |
| 30 | General Authority of Awqaf | $11,238,371,192 | Middle East |
| 31 | Church Commissioners for England | $11,197,700,000 | Europe |
| 32 | J.Paul Getty Trust | $10,778,927,000 | North America |
| 33 | Trinity Wall Street Episcopal Church | $9,932,419,000 | North America |
| 34 | Unitersity of Utah | $9,827,602,000 | North America |
| 35 | Brown University | $9,793,108,000 | North America |
| 36 | Kamehameha Schools | $9,326,013,000 | North America |
| 37 | Dartmouth College | $9,078,340,000 | North America |
| 38 | Hong Kong Jockey Club | $8,603,580,000 | Asia |
| 39 | Rice University | $8,424,555,000 | North America |
| 40 | The Leona M. and Harry B. Helmsley Charitable Trust | $8,313,588,000 | North America |
| 41 | University of Pittsburgh | $8,011,856,000 | North America |
| 42 | Nature Conservancy | $7,870,380,000 | North America |
| 43 | University of Toronto Asset Management Corporation | $7,329,730,000 | North America |
| 44 | University of Rochester | $7,149,025,000 | North America |
| 45 | Virginia Commonwealth University | $6,985,495,306 | North America |
| 46 | Purdue University | $6,755,500,000 | North America |
| 47 | University of Miami | $6,582,600,000 | North America |
| 48 | University of Minnesota | $6,304,508,000 | North America |
| 49 | Caltech Investment Office | $6,252,584,000 | North America |
| 50 | Metropolitan Museum of Art of New York City | $5,588,554,000 | North America |
The largest endowment fund, Ensign Peak Advisors, is based in Salt Lake City, Utah, and manages the assets for the Mormon Church (officially known as the Church of Jesus Christ of Latter-day Saints). The church itself has over 16 million members worldwide and is the fourth largest church in America.
The Japan Science and Technology Agency (JST) is a national research and development agency that plays a core role in promoting technology, innovation, and science within society. In 1995, Japan’s government passed the Science and Technology Basic Plan and the JST came to life and now has over $80 billion in assets as well as offices in Paris, Washington, Singapore, and Beijing.
Just two funds come from the Middle East. The King Abdullah University of Science and Technology (KAUST) with $23.5 billion and the General Authority of Awqaf. KAUST is ranked 95th amongst universities in the world and made history in the country by being Saudi Arabia’s first mixed-gender university.
The General Authority of Awqaf has $11 billion in assets and was established as a public authority to manage endowments and enhance Saudi Arabia’s various goals for societal development. “Awqaf” in Arabic loosely translates to assets that are donated or purchased for general or specific charitable causes that are socially beneficial.
On the environmental side is the Nature Conservancy, which has $7.8 billion in assets. The charity is estimated to have protected more than 100 million acres of land.
American Universities Dominate
Universities are one leading category from the world of endowment funds, particularly those from the United States. In fact, universities make up 39 of the top 50 endowment funds, with 35 of them based in America.
Historically, Harvard has been the largest, but Stanford has edged ahead in recent years. Stanford has $75 billion in assets compared to Harvard’s $73 billion. These vast amounts of money have not gone unnoticed, and elite universities are facing mounting criticism in some circles.
“When Harvard’s total admitted freshman class is 1,400 people—and they have an endowment that is the GDP of El Salvador—they’re not a nonprofit, they’re a hedge fund educating the children of their investors.” – Professor Scott Galloway
With student debt rising to $1.6 trillion, it’s likely these universities may face greater criticism around how they use the wealth available to them in endowment funds.
Sizable Influence
The top endowment funds carry considerable influence within the world of finance. While they all have billions to invest, each has very different objectives and intentions on how to deploy their capital.
And despite being non-profit organizations, endowment funds are seeing their overall assets exceed those held by many other investment funds, such as sovereign wealth funds, hedge funds, and private equity firms.


Money
Charted: Which City Has the Most Billionaires in 2024?
Just two countries account for half of the top 20 cities with the most billionaires. And the majority of the other half are found in Asia.


Charted: Which Country Has the Most Billionaires in 2024?
This was originally posted on our Voronoi app. Download the app for free on iOS or Android and discover incredible data-driven charts from a variety of trusted sources.
Some cities seem to attract the rich. Take New York City for example, which has 340,000 high-net-worth residents with investable assets of more than $1 million.
But there’s a vast difference between being a millionaire and a billionaire. So where do the richest of them all live?
Using data from the Hurun Global Rich List 2024, we rank the top 20 cities with the highest number of billionaires in 2024.
A caveat to these rich lists: sources often vary on figures and exact rankings. For example, in last year’s reports, Forbes had New York as the city with the most billionaires, while the Hurun Global Rich List placed Beijing at the top spot.
Ranked: Top 20 Cities with the Most Billionaires in 2024
The Chinese economy’s doldrums over the course of the past year have affected its ultra-wealthy residents in key cities.
Beijing, the city with the most billionaires in 2023, has not only ceded its spot to New York, but has dropped to #4, overtaken by London and Mumbai.
| Rank | City | Billionaires | Rank Change YoY |
|---|---|---|---|
| 1 | 🇺🇸 New York | 119 | +1 |
| 2 | 🇬🇧 London | 97 | +3 |
| 3 | 🇮🇳 Mumbai | 92 | +4 |
| 4 | 🇨🇳 Beijing | 91 | -3 |
| 5 | 🇨🇳 Shanghai | 87 | -2 |
| 6 | 🇨🇳 Shenzhen | 84 | -2 |
| 7 | 🇭🇰 Hong Kong | 65 | -1 |
| 8 | 🇷🇺 Moscow | 59 | No Change |
| 9 | 🇮🇳 New Delhi | 57 | +6 |
| 10 | 🇺🇸 San Francisco | 52 | No Change |
| 11 | 🇹🇭 Bangkok | 49 | +2 |
| 12 | 🇹🇼 Taipei | 45 | +2 |
| 13 | 🇫🇷 Paris | 44 | -2 |
| 14 | 🇨🇳 Hangzhou | 43 | -5 |
| 15 | 🇸🇬 Singapore | 42 | New to Top 20 |
| 16 | 🇨🇳 Guangzhou | 39 | -4 |
| 17T | 🇮🇩 Jakarta | 37 | +1 |
| 17T | 🇧🇷 Sao Paulo | 37 | No Change |
| 19T | 🇺🇸 Los Angeles | 31 | No Change |
| 19T | 🇰🇷 Seoul | 31 | -3 |
In fact all Chinese cities on the top 20 list have lost billionaires between 2023–24. Consequently, they’ve all lost ranking spots as well, with Hangzhou seeing the biggest slide (-5) in the top 20.
Where China lost, all other Asian cities—except Seoul—in the top 20 have gained ranks. Indian cities lead the way, with New Delhi (+6) and Mumbai (+3) having climbed the most.
At a country level, China and the U.S combine to make up half of the cities in the top 20. They are also home to about half of the world’s 3,200 billionaire population.
In other news of note: Hurun officially counts Taylor Swift as a billionaire, estimating her net worth at $1.2 billion.

-

 Sports1 week ago
The Highest Earning Athletes in Seven Professional Sports
-

 Countries2 weeks ago
Population Projections: The World’s 6 Largest Countries in 2075
-

 Markets2 weeks ago
The Top 10 States by Real GDP Growth in 2023
-

 Demographics2 weeks ago
The Smallest Gender Wage Gaps in OECD Countries
-

 United States2 weeks ago
Where U.S. Inflation Hit the Hardest in March 2024
-

 Green2 weeks ago
Top Countries By Forest Growth Since 2001
-

 United States2 weeks ago
Ranked: The Largest U.S. Corporations by Number of Employees
-

 Maps2 weeks ago
The Largest Earthquakes in the New York Area (1970-2024)