Datastream
Ranked: The World’s 20 Biggest Hedge Funds


The Briefing
- Bridgewater Associates remains the top hedge fund by assets under management (AUM)
- Brevan Howard witnessed strong growth in AUM, moving from 26th to 19th in the ranking
Ranked: The World’s 20 Biggest Hedge Funds
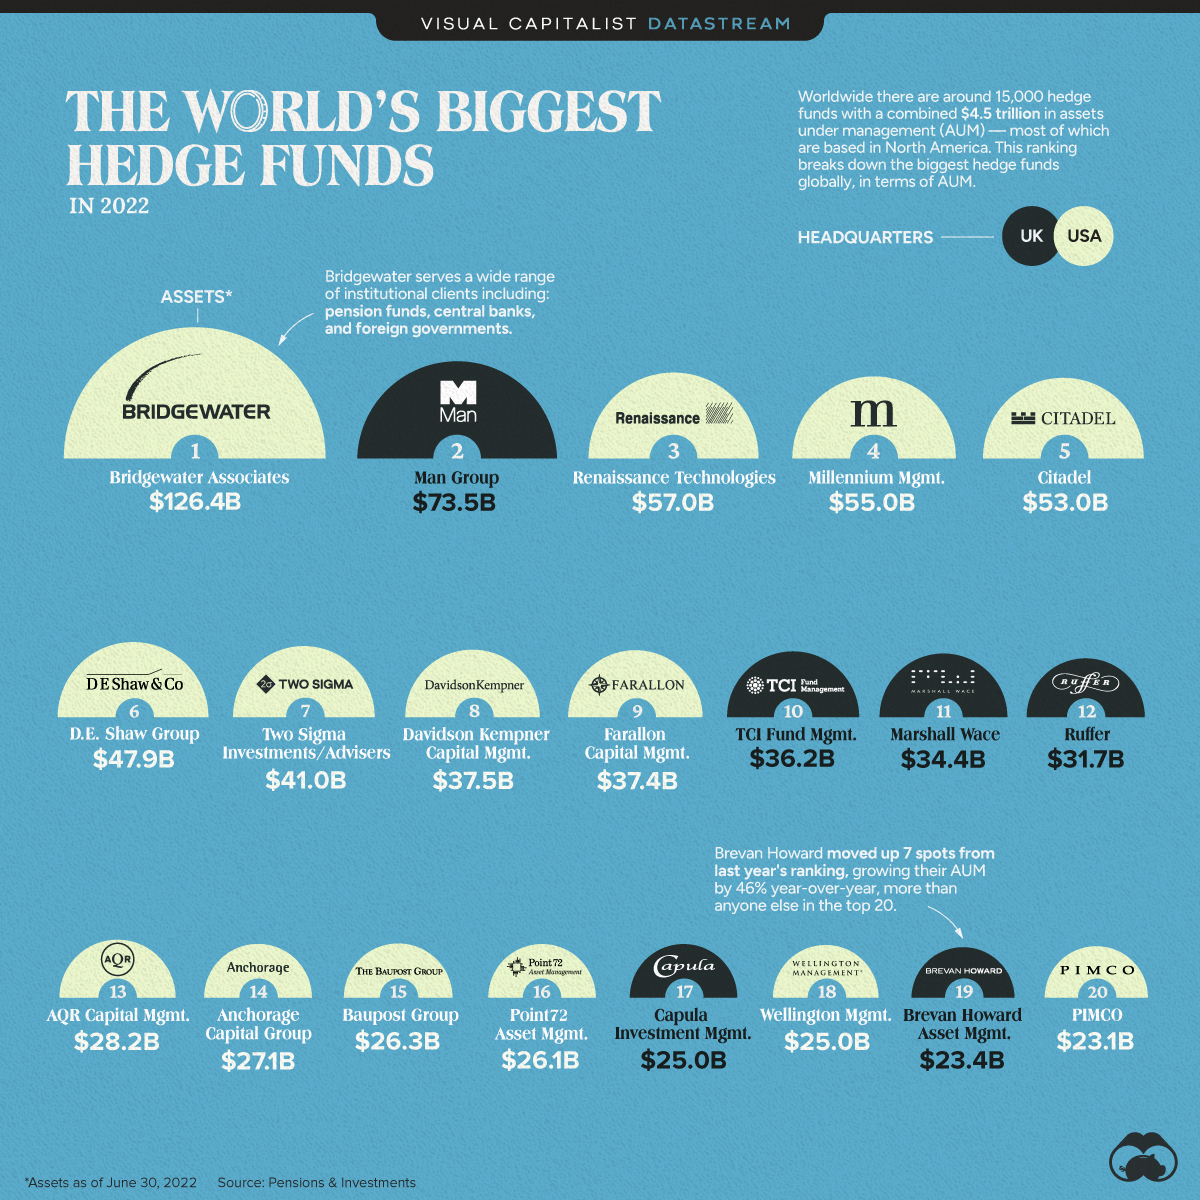
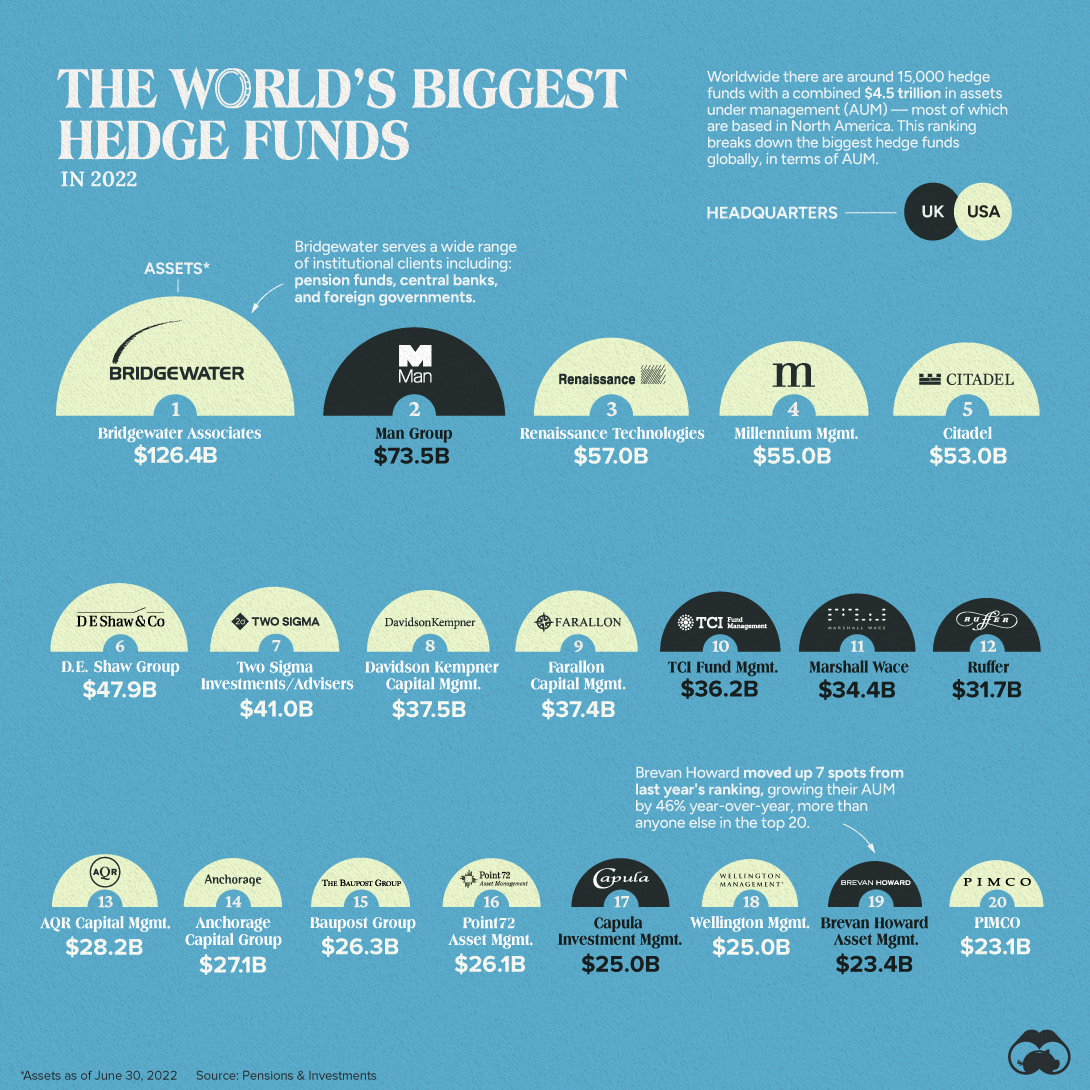
Collectively, the world’s 15,000 hedge funds manage around $4.5 trillion in assets for their clients, weathering economic storms and world events to ensure returns.
This visual breaks down the world’s biggest hedge funds in terms of assets under management using data from Pensions & Investments.
The Top 20
The world’s biggest hedge fund by a mile is Ray Dalio’s Bridgewater Associates. At the time of this ranking, Bridgewater managed over $126 billion in assets for clients as wide ranging as university endowment funds, charities, and foreign country’s central banks.
Here’s a closer look at the ranking:
| Rank | Hedge Fund | Assets (millions USD) | Headquarters |
|---|---|---|---|
| #1 | Bridgewater Associates | $126,400 | 🇺🇸 U.S. |
| #2 | Man Group | $73,500 | 🇬🇧 UK |
| #3 | Renaissance Technologies | $57,000 | 🇺🇸 U.S. |
| #4 | Millennium Management | $54,968 | 🇺🇸 U.S. |
| #5 | Citadel | $52,970 | 🇺🇸 U.S. |
| #6 | D.E. Shaw Group | $47,861 | 🇺🇸 U.S. |
| #7 | Two Sigma Investments/Advisers | $40,969 | 🇺🇸 U.S. |
| #8 | Davidson Kempner Capital Management | $37,450 | 🇺🇸 U.S. |
| #9 | Farallon Capital Management | $37,400 | 🇺🇸 U.S. |
| #10 | TCI Fund Management | $36,200 | 🇬🇧 UK |
| #11 | Marshall Wace | $34,400 | 🇬🇧 UK |
| #12 | Ruffer | $31,662 | 🇬🇧 UK |
| #13 | AOR Capital Management | $28,200 | 🇺🇸 U.S. |
| #14 | Anchorage Capital Group | $27,100 | 🇺🇸 U.S. |
| #15 | Baupost Group | $26,300 | 🇺🇸 U.S. |
| #16 | Point72 Asset Management | $26,100 | 🇺🇸 U.S. |
| #17 | Capula Investment Management | $25,000 | 🇬🇧 UK |
| #18 | Wellington Management | $24,968 | 🇺🇸 U.S. |
| #19 | Brevan Howard Asset Management | $23,353 | 🇬🇧 UK |
| #20 | PIMCO | $23,054 | 🇺🇸 U.S. |
This annual ranking uses AUM data from June 2022
Overall, 70% of hedge funds are headquartered in North America, with many of the world’s largest based in the United States, specifically.
The Fastest Growing Hedge Funds
Many of these large hedge funds were new to the top 20 category, having moved up dramatically from the 2021 ranking. Here’s a look at some of the AUM growth rates year-over-year.
| Rank | Hedge Fund | Growth in AUM (% Change Y-o-Y) |
|---|---|---|
| #1 | Brevan Howard Asset Management | 46.0% |
| #2 | Citadel | 40.8% |
| #3 | PIMCO | 25.3% |
| #4 | D.E. Shaw Group | 20.4% |
| #5 | Point72 Asset Management | 19.7% |
| #6 | Bridgewater Associates | 19.6% |
| #7 | Man Group | 15.9% |
| #8 | Wellington Management | 10.5% |
| #9 | AQR Capital Management | 8.0% |
| #10 | Millennium Management | 5.1% |
| #11 | Capula Investment Management | 4.6% |
| #12 | Marshall Wace | 3.9% |
| #13 | Two Sigma Investments/Advisers | 3.6% |
| #14 | Davidson Kempner Capital Management | 0.3% |
| #15 | Renaissance Technologies | -1.7% |
| #16 | Farallon Capital Management | -1.8% |
| #17 | TCI Fund Management | -9.5% |
| #18 | Anchorage Capital Group | -12.8% |
| #19 | Baupost Group | -15.2% |
| #20 | Ruffer | - |
UK-based Brevan Howard jumped from 26th to 19th, witnessing a 46% increase in their assets under management.
Hedge fund growth can be uncorrelated with the broader market, and is not necessarily an indicator of the overall economy. However, analyzing the strategies used by hedge funds and their performance can often provide useful insight for investors.
Where does this data come from?
Source: The Pensions & Investments annual ranking of largest hedge funds.
Source: This ranking uses AUM data from June 2022. This visualization can be used as a consistent snapshot of the size and proportionality of hedge funds. Current AUM for each may very.


Datastream
Can You Calculate Your Daily Carbon Footprint?
Discover how the average person’s carbon footprint impacts the environment and learn how carbon credits can offset your carbon footprint.


The Briefing
- A person’s carbon footprint is substantial, with activities such as food consumption creating as much as 4,500 g of CO₂ emissions daily.
- By purchasing carbon credits from Carbon Streaming Corporation, you can offset your own emissions and fund positive climate action.
Your Everyday Carbon Footprint
While many large businesses and countries have committed to net-zero goals, it is essential to acknowledge that your everyday activities also contribute to global emissions.
In this graphic, sponsored by Carbon Streaming Corporation, we will explore how the choices we make and the products we use have a profound impact on our carbon footprint.
Carbon Emissions by Activity
Here are some of the daily activities and products of the average person and their carbon footprint, according to Clever Carbon.
| Household Activities & Products | CO2 Emissions (g) |
|---|---|
| 💡 Standard Light Bulb (100 watts, four hours) | 172 g |
| 📱 Mobile Phone Use (195 minutes per day)* | 189 g |
| 👕 Washing Machine (0.63 kWh) | 275 g |
| 🔥 Electric Oven (1.56 kWh) | 675 g |
| ♨️ Tumble Dryer (2.5 kWh) | 1,000 g |
| 🧻 Toilet Roll (2 ply) | 1,300 g |
| 🚿 Hot Shower (10 mins) | 2,000 g |
| 🚙 Daily Commute (one hour, by car) | 3,360 g |
| 🍽️ Average Daily Food Consumption (three meals of 600 calories) | 4,500 g |
| *Phone use based on yearly use of 69kg per the source, Reboxed | |
Your choice of transportation plays a crucial role in determining your carbon footprint. For instance, a 15 km daily commute to work on public transport generates an average of 1,464 g of CO₂ emissions. Compared to 3,360 g—twice the volume for a journey the same length by car.
By opting for more sustainable modes of transport, such as cycling, walking, or public transportation, you can significantly reduce your carbon footprint.
Addressing Your Carbon Footprint
One way to compensate for your emissions is by purchasing high-quality carbon credits.
Carbon credits are used to help fund projects that avoid, reduce or remove CO₂ emissions. This includes nature-based solutions such as reforestation and improved forest management, or technology-based solutions such as the production of biochar and carbon capture and storage (CCS).
While carbon credits offer a potential solution for individuals to help reduce global emissions, public awareness remains a significant challenge. A BCG-Patch survey revealed that only 34% of U.S. consumers are familiar with carbon credits, and only 3% have purchased them in the past.
About Carbon Streaming
By financing the creation or expansion of carbon projects, Carbon Streaming Corporation secures the rights to future carbon credits generated by these sustainable projects. You can then purchase these carbon credits to help fund climate solutions around the world and compensate for your own emissions.
Ready to get involved?
>> Learn more about purchasing carbon credits at Carbon Streaming

-

 Energy1 week ago
The World’s Biggest Nuclear Energy Producers
-

 Money2 weeks ago
Which States Have the Highest Minimum Wage in America?
-

 Technology2 weeks ago
Ranked: Semiconductor Companies by Industry Revenue Share
-

 Markets2 weeks ago
Ranked: The World’s Top Flight Routes, by Revenue
-

 Countries2 weeks ago
Population Projections: The World’s 6 Largest Countries in 2075
-

 Markets2 weeks ago
The Top 10 States by Real GDP Growth in 2023
-

 Demographics2 weeks ago
The Smallest Gender Wage Gaps in OECD Countries
-

 United States2 weeks ago
Where U.S. Inflation Hit the Hardest in March 2024