Money
Visualizing the Assets and Liabilities of U.S. Banks
![]() Subscribe to the Elements free mailing list for more like this
Subscribe to the Elements free mailing list for more like this


Understanding the Assets and Liabilities of U.S. Banks
This was originally posted on Elements. Sign up to the free mailing list to get beautiful visualizations on real assets and resource megatrends each week.
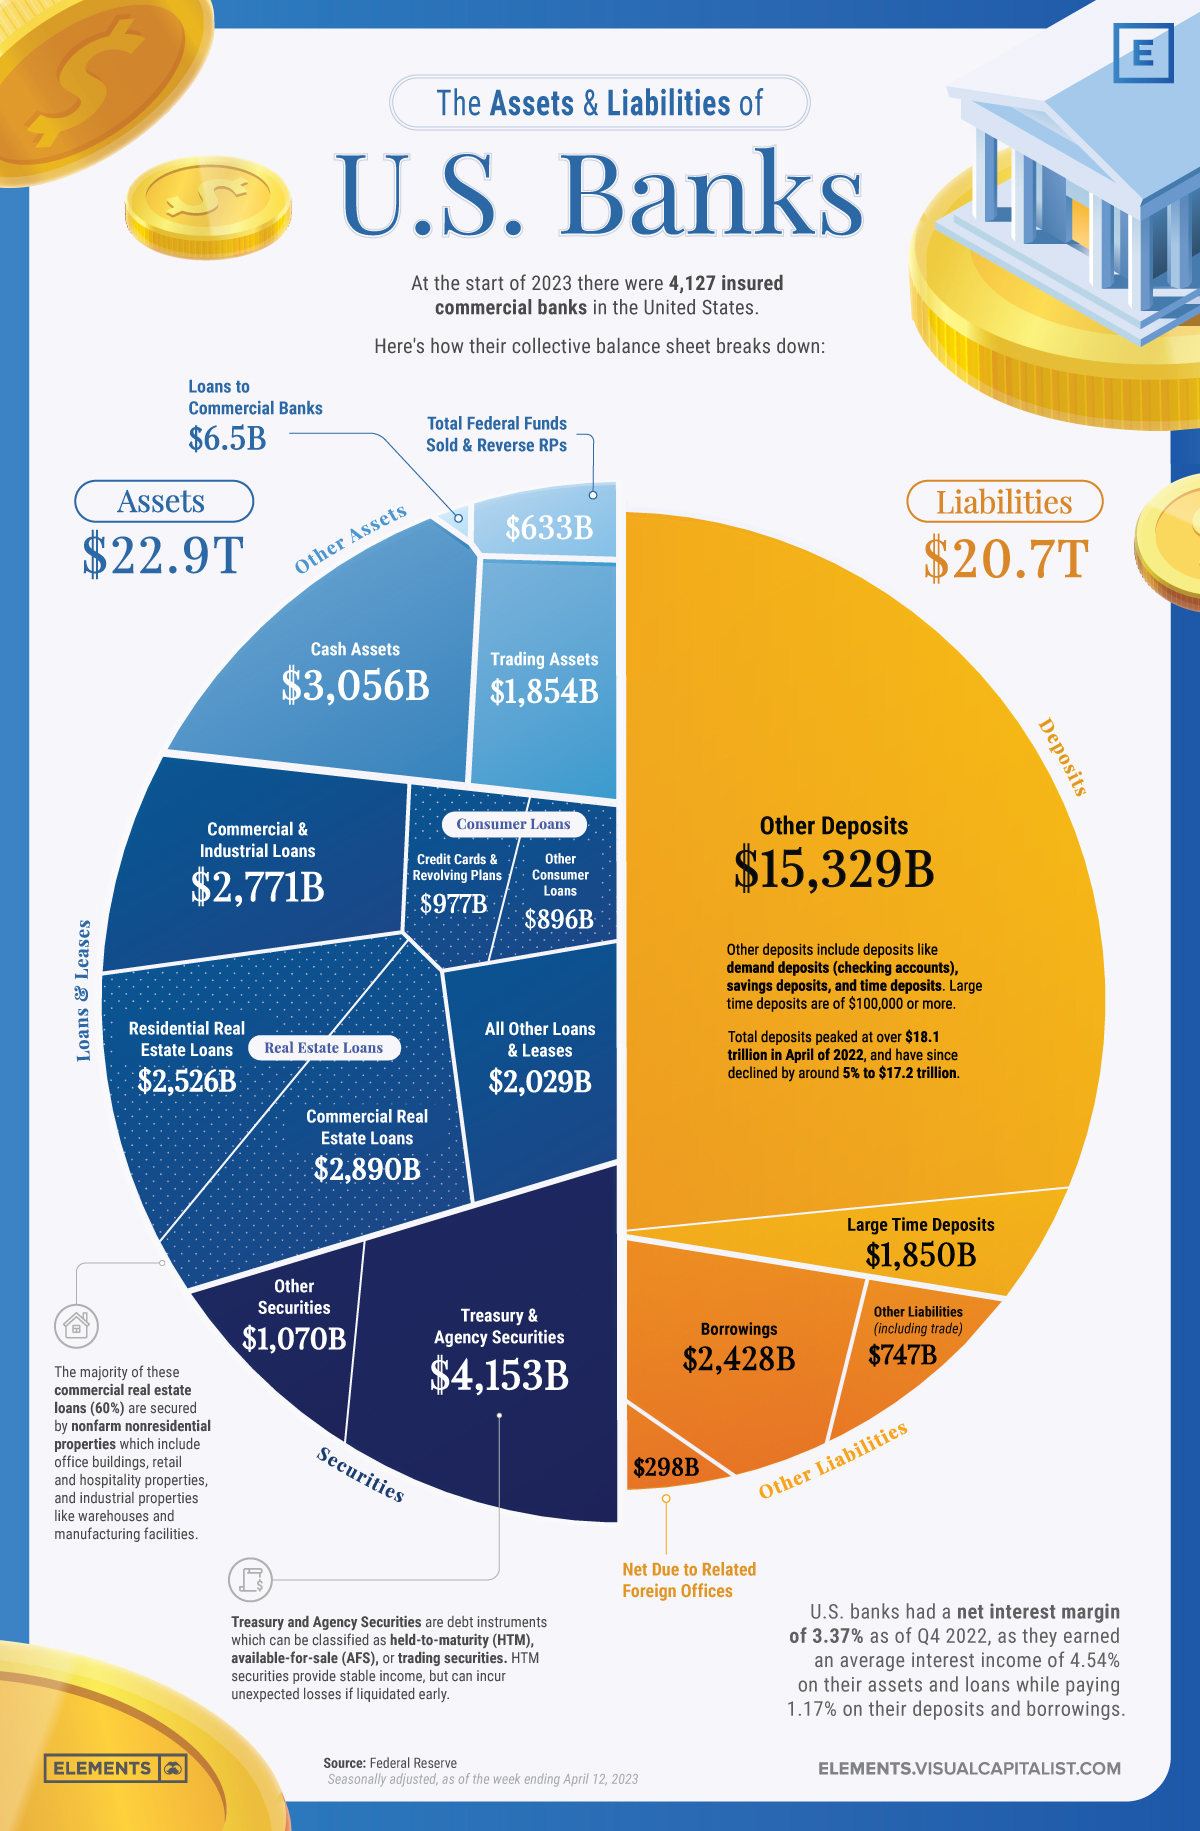
The U.S. banking sector has more than 4,000 FDIC-insured banks that play a crucial role in the country’s economy by securely storing deposits and providing credit in the form of loans.
This infographic visualizes all of the deposits, loans, and other assets and liabilities that make up the collective balance sheet of U.S banks using data from the Federal Reserve.
With the spotlight on the banking sector after the collapses of Signature Bank, Silicon Valley Bank, and First Republic bank, understanding the assets and liabilities that make up banks’ balance sheets can give insight in how they operate and why they sometimes fail.
Assets: The Building Blocks of Banks’ Business
Assets are the foundation of a bank’s operations, serving as a base to provide loans and credit while also generating income.
A healthy asset portfolio with a mix of loans along with long-dated and short-dated securities is essential for a bank’s financial stability, especially since assets not marked to market may have a lower value than expected if liquidated early.
As of Q4 2022, U.S. banks generated an average interest income of 4.54% on all assets.
Loans and Leases
Loans and leases are the primary income-generating assets for banks, making up 53% of the assets held by U.S. banks.
These include:
- Real estate loans for residential and commercial properties (45% of all loans and leases)
- Commercial and industrial loans for business operations (23% of all loans and leases)
- Consumer loans for personal needs like credit cards and auto loans (15% of all loans and leases)
- Various other kinds of credit (17% of all loans and leases)
Securities
Securities make up the next largest portion of U.S. banks’ assets (23%) at $5.2 trillion. Banks primarily invest in Treasury and agency securities, which are debt instruments issued by the U.S. government and its agencies.
These securities can be categorized into three types:
- Held-to-maturity (HTM) securities, which are held until they mature and provide a stable income stream
- Available-for-sale (AFS) securities, which can be sold before maturity
- Trading securities, held for short-term trading to profit from price fluctuations
Along with Treasury and agency securities which make up the significant majority (80%) of U.S. banks’ securities, banks also invest in other securities which are non-government-issued debt instruments like corporate bonds, mortgage-backed securities, and asset-backed securities.
Cash Assets
Cash assets are a small but essential part of U.S. banks’ balance sheets, making up $3.1 trillion or 13% of all assets. Having enough cash assets ensures adequate liquidity needed to meet short-term obligations and regulatory requirements.
Cash assets include physical currency held in bank vaults, pending collections, and cash balances in accounts with other banks.
Liabilities: Banks’ Financial Obligations
Liabilities represent the obligations banks must fulfill, including customer deposits and borrowings. Careful management of liabilities is essential to maintain liquidity, manage risk, and ensure a bank’s overall solvency.
Deposits
Deposits make up the largest portion of banks’ liabilities as they represent the money that customers entrust to these institutions. It’s important to note that the FDIC insures deposit accounts up to $250,000 per depositor, per insured bank, for each type of account (like single accounts, joint accounts, and retirement accounts).
There are two primary types of deposits, large time deposits and other deposits. Large time deposits are defined by the FDIC as time deposits exceeding $100,000, while other deposits include checking accounts, savings accounts, and smaller time deposits.
U.S. banks had $17.18 trillion in overall deposits as of April 12th 2023, with other deposits accounting for 74% of the overall liabilities while large time deposits made up 9%.
Borrowings
After deposits, borrowings are the next largest liability on the balance sheet of U.S. banks, making up nearly 12% of all liabilities at $2.4 trillion.
These include short-term borrowings from other banks or financial institutions such as Federal Funds and repurchase agreements, along with long-term borrowings like subordinated debt which ranks below other loans and securities in the event of a default.
How Deposits, Rates, and Balance Sheets Affect Bank Failures
Just like any other business, banks have to balance their finances to remain solvent; however, successful banking also relies heavily on the trust of depositors.
While in other businesses an erosion of trust with customers might lead to breakdowns in future business deals and revenues, only in banking can a dissolution in customer trust swiftly turn into the immediate removal of deposits that backstop all revenue-generating opportunities.
Although recent bank collapses aren’t solely due to depositors withdrawing funds, bank runs have played a significant role. Most recently, in First Republic’s case, depositors pulled out more than $101 billion in Q1 of 2023, which would’ve been more than 50% of their total deposits, had some of America’s largest banks not injected $30 billion in deposits on March 16th.
It’s important to remember that the rapidly spreading fires of bank runs are initially sparked by poor asset management, which can sometimes be detected on banks’ balance sheets.
A combination of excessive investment in long-dated held-to-maturity securities, one of the fastest rate hiking cycles in recent history, and many depositors fearing for and moving their uninsured deposits of over $250,000 has resulted in the worst year ever for bank failures in terms of total assets.


Money
How Debt-to-GDP Ratios Have Changed Since 2000
See how much the debt-to-GDP ratios of advanced economies have grown (or shrank) since the year 2000.


How Debt-to-GDP Ratios Have Changed Since 2000
This was originally posted on our Voronoi app. Download the app for free on Apple or Android and discover incredible data-driven charts from a variety of trusted sources.
Government debt levels have grown in most parts of the world since the 2008 financial crisis, and even more so after the COVID-19 pandemic.
To gain perspective on this long-term trend, we’ve visualized the debt-to-GDP ratios of advanced economies, as of 2000 and 2024 (estimated). All figures were sourced from the IMF’s World Economic Outlook.
Data and Highlights
The data we used to create this graphic is listed in the table below. “Government gross debt” consists of all liabilities that require payment(s) of interest and/or principal in the future.
| Country | 2000 (%) | 2024 (%) | Change (pp) |
|---|---|---|---|
| 🇯🇵 Japan | 135.6 | 251.9 | +116.3 |
| 🇸🇬 Singapore | 82.3 | 168.3 | +86.0 |
| 🇺🇸 United States | 55.6 | 126.9 | +71.3 |
| 🇬🇧 United Kingdom | 36.6 | 105.9 | +69.3 |
| 🇬🇷 Greece | 104.9 | 160.2 | +55.3 |
| 🇫🇷 France | 58.9 | 110.5 | +51.6 |
| 🇵🇹 Portugal | 54.2 | 104.0 | +49.8 |
| 🇪🇸 Spain | 57.8 | 104.7 | +46.9 |
| 🇸🇮 Slovenia | 25.9 | 66.5 | +40.6 |
| 🇫🇮 Finland | 42.4 | 76.5 | +34.1 |
| 🇭🇷 Croatia | 35.4 | 61.8 | +26.4 |
| 🇨🇦 Canada | 80.4 | 103.3 | +22.9 |
| 🇨🇾 Cyprus | 56.0 | 70.9 | +14.9 |
| 🇦🇹 Austria | 65.7 | 74.0 | +8.3 |
| 🇸🇰 Slovak Republic | 50.5 | 56.5 | +6.0 |
| 🇩🇪 Germany | 59.3 | 64.0 | +4.7 |
| 🇧🇪 Belgium | 109.6 | 106.8 | -2.8 |
| 🇮🇱 Israel | 77.4 | 56.8 | -20.6 |
| 🇮🇸 Iceland | 75.8 | 54.6 | -21.2 |
The debt-to-GDP ratio indicates how much a country owes compared to the size of its economy, reflecting its ability to manage and repay debts. Percentage point (pp) changes shown above indicate the increase or decrease of these ratios.
Countries with the Biggest Increases
Japan (+116 pp), Singapore (+86 pp), and the U.S. (+71 pp) have grown their debt as a percentage of GDP the most since the year 2000.
All three of these countries have stable, well-developed economies, so it’s unlikely that any of them will default on their growing debts. With that said, higher government debt leads to increased interest payments, which in turn can diminish available funds for future government budgets.
This is a rising issue in the U.S., where annual interest payments on the national debt have surpassed $1 trillion for the first time ever.
Only 3 Countries Saw Declines
Among this list of advanced economies, Belgium (-2.8 pp), Iceland (-21.2 pp), and Israel (-20.6 pp) were the only countries that decreased their debt-to-GDP ratio since the year 2000.
According to Fitch Ratings, Iceland’s debt ratio has decreased due to strong GDP growth and the use of its cash deposits to pay down upcoming maturities.
See More Debt Graphics from Visual Capitalist
Curious to see which countries have the most government debt in dollars? Check out this graphic that breaks down $97 trillion in debt as of 2023.

-

 Real Estate2 weeks ago
Visualizing America’s Shortage of Affordable Homes
-

 Technology1 week ago
Ranked: Semiconductor Companies by Industry Revenue Share
-

 Money1 week ago
Which States Have the Highest Minimum Wage in America?
-

 Real Estate1 week ago
Ranked: The Most Valuable Housing Markets in America
-

 Business2 weeks ago
Charted: Big Four Market Share by S&P 500 Audits
-

 AI2 weeks ago
The Stock Performance of U.S. Chipmakers So Far in 2024
-

 Misc2 weeks ago
Almost Every EV Stock is Down After Q1 2024
-

 Money2 weeks ago
Where Does One U.S. Tax Dollar Go?