Markets
Recession Risk: Which Sectors are Least Vulnerable?
Subscribe to the Advisor Channel free mailing list for more like this
Recession Risk: Which Sectors are Least Vulnerable?
This was originally posted on Advisor Channel. Sign up to the free mailing list to get beautiful visualizations on financial markets that help advisors and their clients.
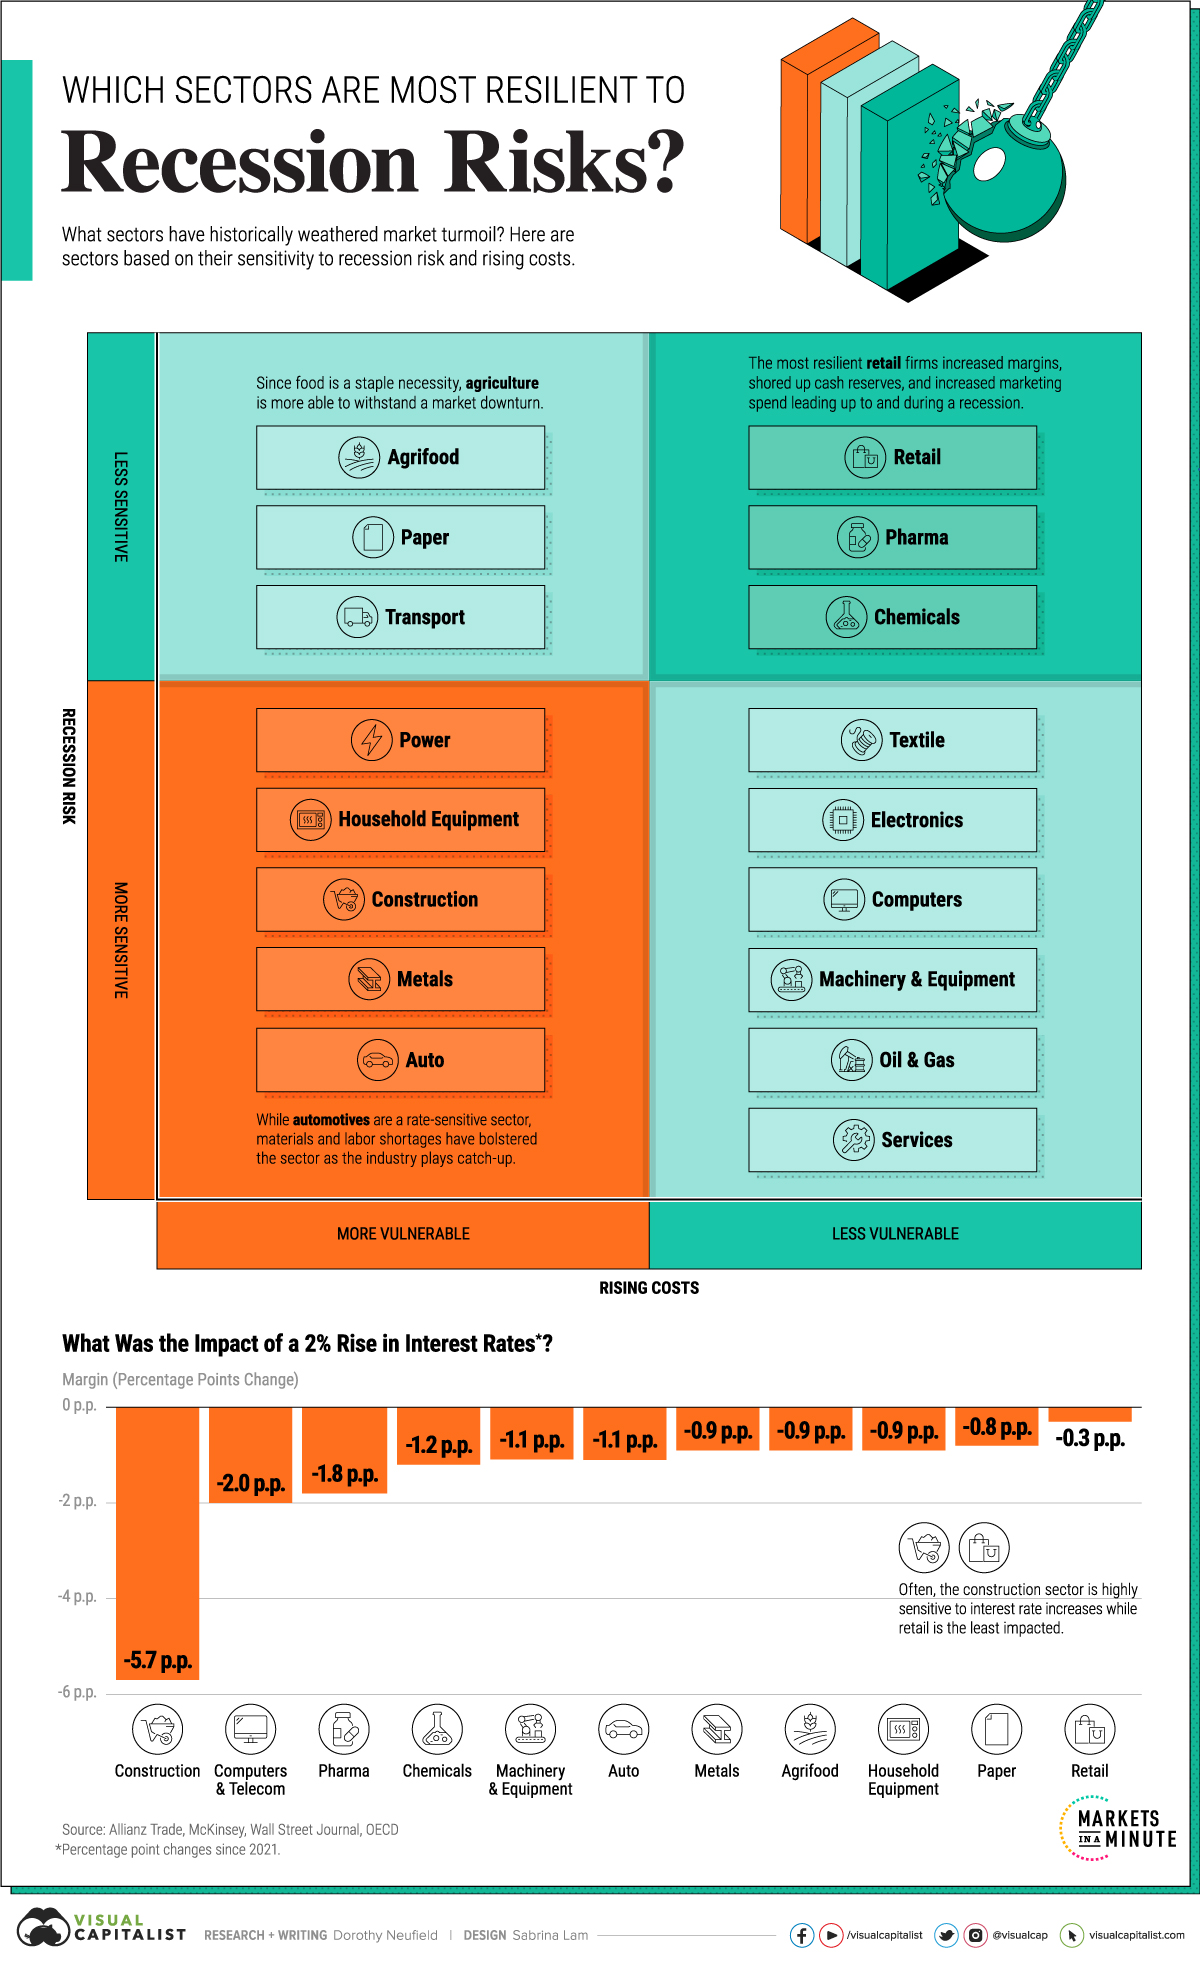
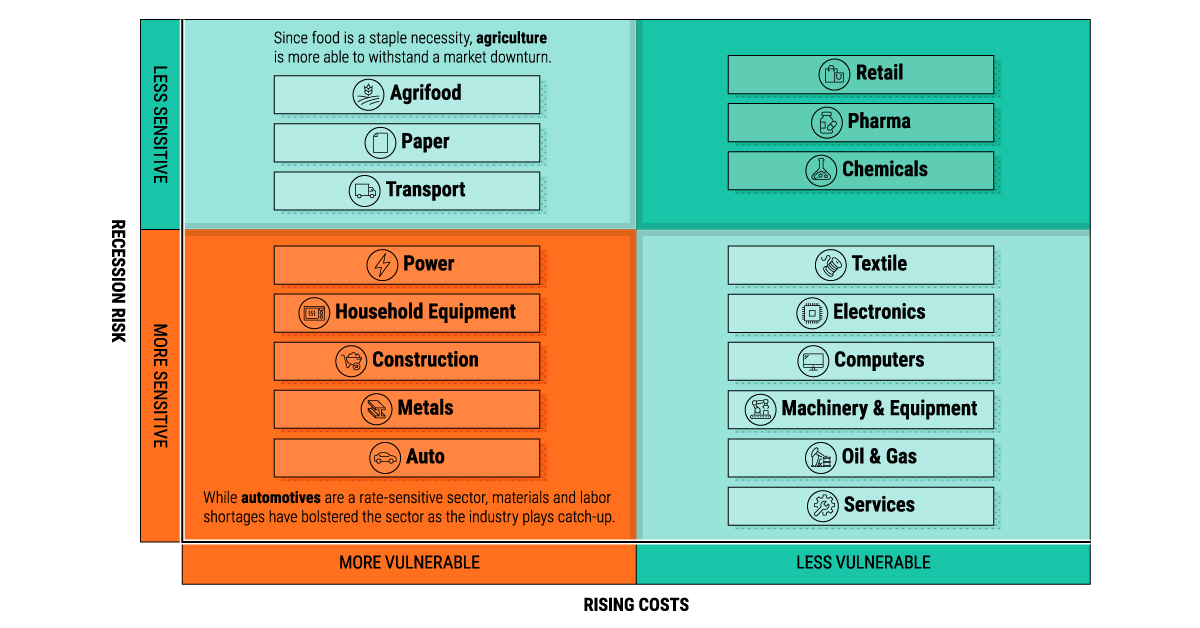
In the context of a potential recession, some sectors may be in better shape than others.
They share several fundamental qualities, including:
- Less cyclical exposure
- Lower rate sensitivity
- Higher cash levels
- Lower capital expenditures
With this in mind, the above chart looks at the sectors most resilient to recession risk and rising costs, using data from Allianz Trade.
Recession Risk, by Sector
As slower growth and rising rates put pressure on corporate margins and the cost of capital, we can see in the table below that this has impacted some sectors more than others in the last year:
| Sector | Margin (p.p. change) |
|---|---|
| 🛒 Retail | -0.3 |
| 📝 Paper | -0.8 |
| 🏡 Household Equipment | -0.9 |
| 🚜 Agrifood | -0.9 |
| ⛏️ Metals | -0.9 |
| 🚗 Automotive Manufacturers | -1.1 |
| 🏭 Machinery & Equipment | -1.1 |
| 🧪 Chemicals | -1.2 |
| 🏥 Pharmaceuticals | -1.8 |
| 🖥️ Computers & Telecom | -2.0 |
| 👷 Construction | -5.7 |
*Percentage point changes 2021- 2022.
Generally speaking, the retail sector has been shielded from recession risk and higher prices. In 2023, accelerated consumer spending and a strong labor market has supported retail sales, which have trended higher since 2021. Consumer spending makes up roughly two-thirds of the U.S. economy.
Sectors including chemicals and pharmaceuticals have traditionally been more resistant to market turbulence, but have fared worse than others more recently.
In theory, sectors including construction, metals, and automotives are often rate-sensitive and have high capital expenditures. Yet, what we have seen in the last year is that many of these sectors have been able to withstand margin pressures fairly well in spite of tightening credit conditions as seen in the table above.
What to Watch: Corporate Margins in Perspective
One salient feature of the current market environment is that corporate profit margins have approached historic highs.
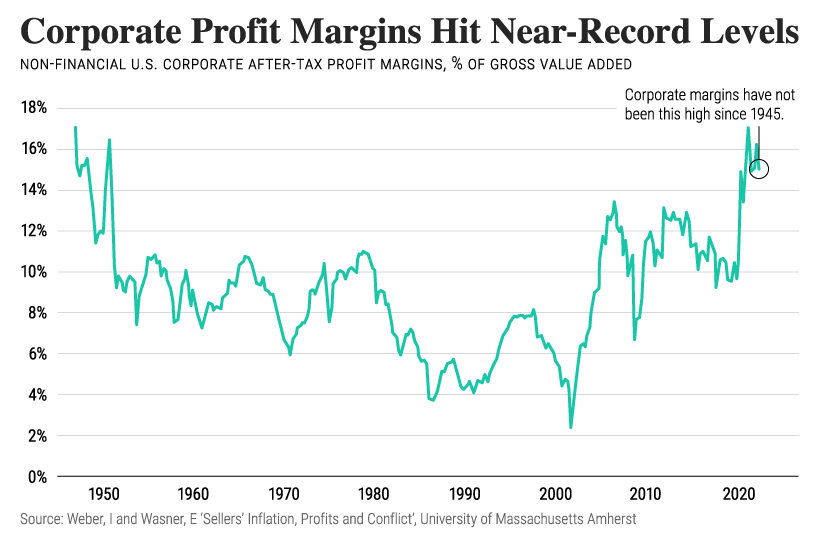
As the above chart shows, after-tax profit margins for non-financial corporations hovered over 14% in 2022, the highest post-WWII. In fact, this trend has been increasing over the past two decades.
According to a recent paper, firms have used their market power to increase prices. As a result, this offset margin pressures, even as sales volume declined.
Overall, we can see that corporate profit margins are higher than pre-pandemic levels. Sectors focused on essential goods to the consumer were able to make price hikes as consumers purchased familiar brands and products.
Adding to stronger margins were demand shocks that stemmed from supply chain disruptions. The auto sector, for example, saw companies raise prices without the fear of diminishing market share. All of these factors have likely built up a buffer to help reduce future recession risk.
Sector Fundamentals Looking Ahead
How are corporate metrics looking in 2023?
In the first quarter of 2023, S&P 500 earnings fell almost 4%. It was the second consecutive quarter of declining earnings for the index. Despite slower growth, the S&P 500 is up roughly 15% from lows seen in October.
Yet according to an April survey from the Bank of America, global fund managers are overwhelmingly bearish, highlighting contradictions in the market.
For health care and utilities sectors, the vast majority of companies in the index are beating revenue estimates in 2023. Over the last 30 years, these defensive sectors have also tended to outperform other sectors during a downturn, along with consumer staples. Investors seek them out due to their strong balance sheets and profitability during market stress.
| S&P 500 Sector | Percent of Companies With Revenues Above Estimates (Q1 2023) |
|---|---|
| Health Care | 90% |
| Utilities | 88% |
| Consumer Discretionary | 81% |
| Real Estate | 81% |
| Information Technology | 78% |
| Industrials | 78% |
| Consumer Staples | 74% |
| Energy | 70% |
| Financials | 65% |
| Communication Services | 58% |
| Materials | 31% |
Source: Factset
Cyclical sectors, such as financials and industrials tend to perform worse. We can see this today with turmoil in the banking system, as bank stocks remain sensitive to interest rate hikes. Making matters worse, the spillover from rising rates may still take time to materialize.
Defensive sectors like health care, staples, and utilities could be less vulnerable to recession risk. Lower correlation to economic cycles, lower rate-sensitivity, higher cash buffers, and lower capital expenditures are all key factors that support their resilience.


Markets
The European Stock Market: Attractive Valuations Offer Opportunities
On average, the European stock market has valuations that are nearly 50% lower than U.S. valuations. But how can you access the market?


European Stock Market: Attractive Valuations Offer Opportunities
Europe is known for some established brands, from L’Oréal to Louis Vuitton. However, the European stock market offers additional opportunities that may be lesser known.
The above infographic, sponsored by STOXX, outlines why investors may want to consider European stocks.
Attractive Valuations
Compared to most North American and Asian markets, European stocks offer lower or comparable valuations.
| Index | Price-to-Earnings Ratio | Price-to-Book Ratio |
|---|---|---|
| EURO STOXX 50 | 14.9 | 2.2 |
| STOXX Europe 600 | 14.4 | 2 |
| U.S. | 25.9 | 4.7 |
| Canada | 16.1 | 1.8 |
| Japan | 15.4 | 1.6 |
| Asia Pacific ex. China | 17.1 | 1.8 |
Data as of February 29, 2024. See graphic for full index names. Ratios based on trailing 12 month financials. The price to earnings ratio excludes companies with negative earnings.
On average, European valuations are nearly 50% lower than U.S. valuations, potentially offering an affordable entry point for investors.
Research also shows that lower price ratios have historically led to higher long-term returns.
Market Movements Not Closely Connected
Over the last decade, the European stock market had low-to-moderate correlation with North American and Asian equities.
The below chart shows correlations from February 2014 to February 2024. A value closer to zero indicates low correlation, while a value of one would indicate that two regions are moving in perfect unison.
| EURO STOXX 50 | STOXX EUROPE 600 | U.S. | Canada | Japan | Asia Pacific ex. China |
|
|---|---|---|---|---|---|---|
| EURO STOXX 50 | 1.00 | 0.97 | 0.55 | 0.67 | 0.24 | 0.43 |
| STOXX EUROPE 600 | 1.00 | 0.56 | 0.71 | 0.28 | 0.48 | |
| U.S. | 1.00 | 0.73 | 0.12 | 0.25 | ||
| Canada | 1.00 | 0.22 | 0.40 | |||
| Japan | 1.00 | 0.88 | ||||
| Asia Pacific ex. China | 1.00 |
Data is based on daily USD returns.
European equities had relatively independent market movements from North American and Asian markets. One contributing factor could be the differing sector weights in each market. For instance, technology makes up a quarter of the U.S. market, but health care and industrials dominate the broader European market.
Ultimately, European equities can enhance portfolio diversification and have the potential to mitigate risk for investors.
Tracking the Market
For investors interested in European equities, STOXX offers a variety of flagship indices:
| Index | Description | Market Cap |
|---|---|---|
| STOXX Europe 600 | Pan-regional, broad market | €10.5T |
| STOXX Developed Europe | Pan-regional, broad-market | €9.9T |
| STOXX Europe 600 ESG-X | Pan-regional, broad market, sustainability focus | €9.7T |
| STOXX Europe 50 | Pan-regional, blue-chip | €5.1T |
| EURO STOXX 50 | Eurozone, blue-chip | €3.5T |
Data is as of February 29, 2024. Market cap is free float, which represents the shares that are readily available for public trading on stock exchanges.
The EURO STOXX 50 tracks the Eurozone’s biggest and most traded companies. It also underlies one of the world’s largest ranges of ETFs and mutual funds. As of November 2023, there were €27.3 billion in ETFs and €23.5B in mutual fund assets under management tracking the index.
“For the past 25 years, the EURO STOXX 50 has served as an accurate, reliable and tradable representation of the Eurozone equity market.”
— Axel Lomholt, General Manager at STOXX
Partnering with STOXX to Track the European Stock Market
Are you interested in European equities? STOXX can be a valuable partner:
- Comprehensive, liquid and investable ecosystem
- European heritage, global reach
- Highly sophisticated customization capabilities
- Open architecture approach to using data
- Close partnerships with clients
- Part of ISS STOXX and Deutsche Börse Group
With a full suite of indices, STOXX can help you benchmark against the European stock market.
Learn how STOXX’s European indices offer liquid and effective market access.

-

 Economy2 days ago
Economic Growth Forecasts for G7 and BRICS Countries in 2024
The IMF has released its economic growth forecasts for 2024. How do the G7 and BRICS countries compare?
-

 Markets1 week ago
U.S. Debt Interest Payments Reach $1 Trillion
U.S. debt interest payments have surged past the $1 trillion dollar mark, amid high interest rates and an ever-expanding debt burden.
-

 United States2 weeks ago
Ranked: The Largest U.S. Corporations by Number of Employees
We visualized the top U.S. companies by employees, revealing the massive scale of retailers like Walmart, Target, and Home Depot.
-

 Markets2 weeks ago
The Top 10 States by Real GDP Growth in 2023
This graphic shows the states with the highest real GDP growth rate in 2023, largely propelled by the oil and gas boom.
-

 Markets2 weeks ago
Ranked: The World’s Top Flight Routes, by Revenue
In this graphic, we show the highest earning flight routes globally as air travel continued to rebound in 2023.
-

 Markets3 weeks ago
Ranked: The Most Valuable Housing Markets in America
The U.S. residential real estate market is worth a staggering $47.5 trillion. Here are the most valuable housing markets in the country.


-

 Misc1 week ago
How Hard Is It to Get Into an Ivy League School?
-

 Technology2 weeks ago
Ranked: Semiconductor Companies by Industry Revenue Share
-
Markets2 weeks ago
Ranked: The World’s Top Flight Routes, by Revenue
-

 Countries2 weeks ago
Population Projections: The World’s 6 Largest Countries in 2075
-
Markets2 weeks ago
The Top 10 States by Real GDP Growth in 2023
-

 Demographics2 weeks ago
The Smallest Gender Wage Gaps in OECD Countries
-

 Economy2 weeks ago
Where U.S. Inflation Hit the Hardest in March 2024
-

 Green2 weeks ago
Top Countries By Forest Growth Since 2001