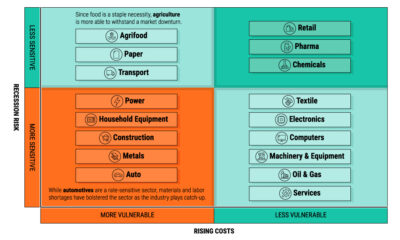

We show the sectors with the lowest exposure to recession risk—and the factors that drive their performance.


Consumers are expecting more this Black Friday, but for retailers, the pressure is mounting. Here are 10 trends that may impact them in 2023.
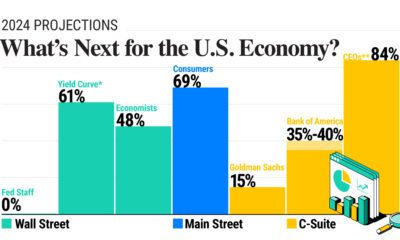

In this graphic, we show the probability of a U.S. recession in 2024, based on forecasts from Wall Street, Main Street, and the C-Suite.


Just four economies around the world had inflation below 2% in 2022. We show the countries with the lowest inflation globally.
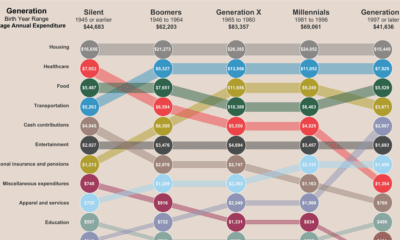

This interactive graphic shows a breakdown of how average Americans spend their money, and how expenses vary across generations.


This graphic compares the cost of living and purchasing power of 578 cities worldwide, using New York City as a benchmark for comparison.
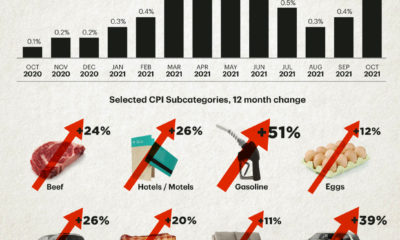

The U.S. inflation rate has seen its fastest annual increase in over 30 years. Which consumer spending categories have been hit the hardest?
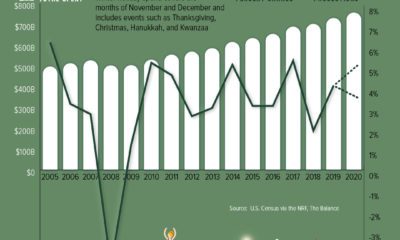

U.S. holiday spending is expected to reach an all-time high of up to $767 billion this holiday season. See how this compares to past years.
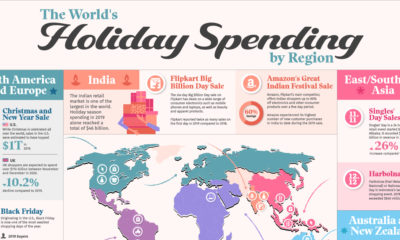

This graphic illustrates some of the largest and most anticipated retail holidays by region and explores their origins.
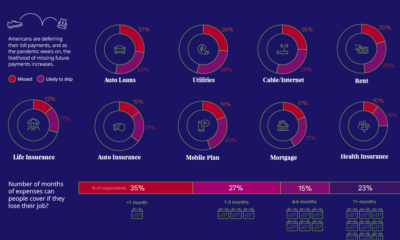

57% of U.S. consumers' incomes have taken a hit during the pandemic. How do such financial anxieties affect the ability to pay bills on time?


 Creator Program