Retail
How Holiday Spending Compares Around the World
View the full-resolution version of this infographic
How Holiday Spending Compares Around the World
View the high-resolution of the infographic by clicking here.
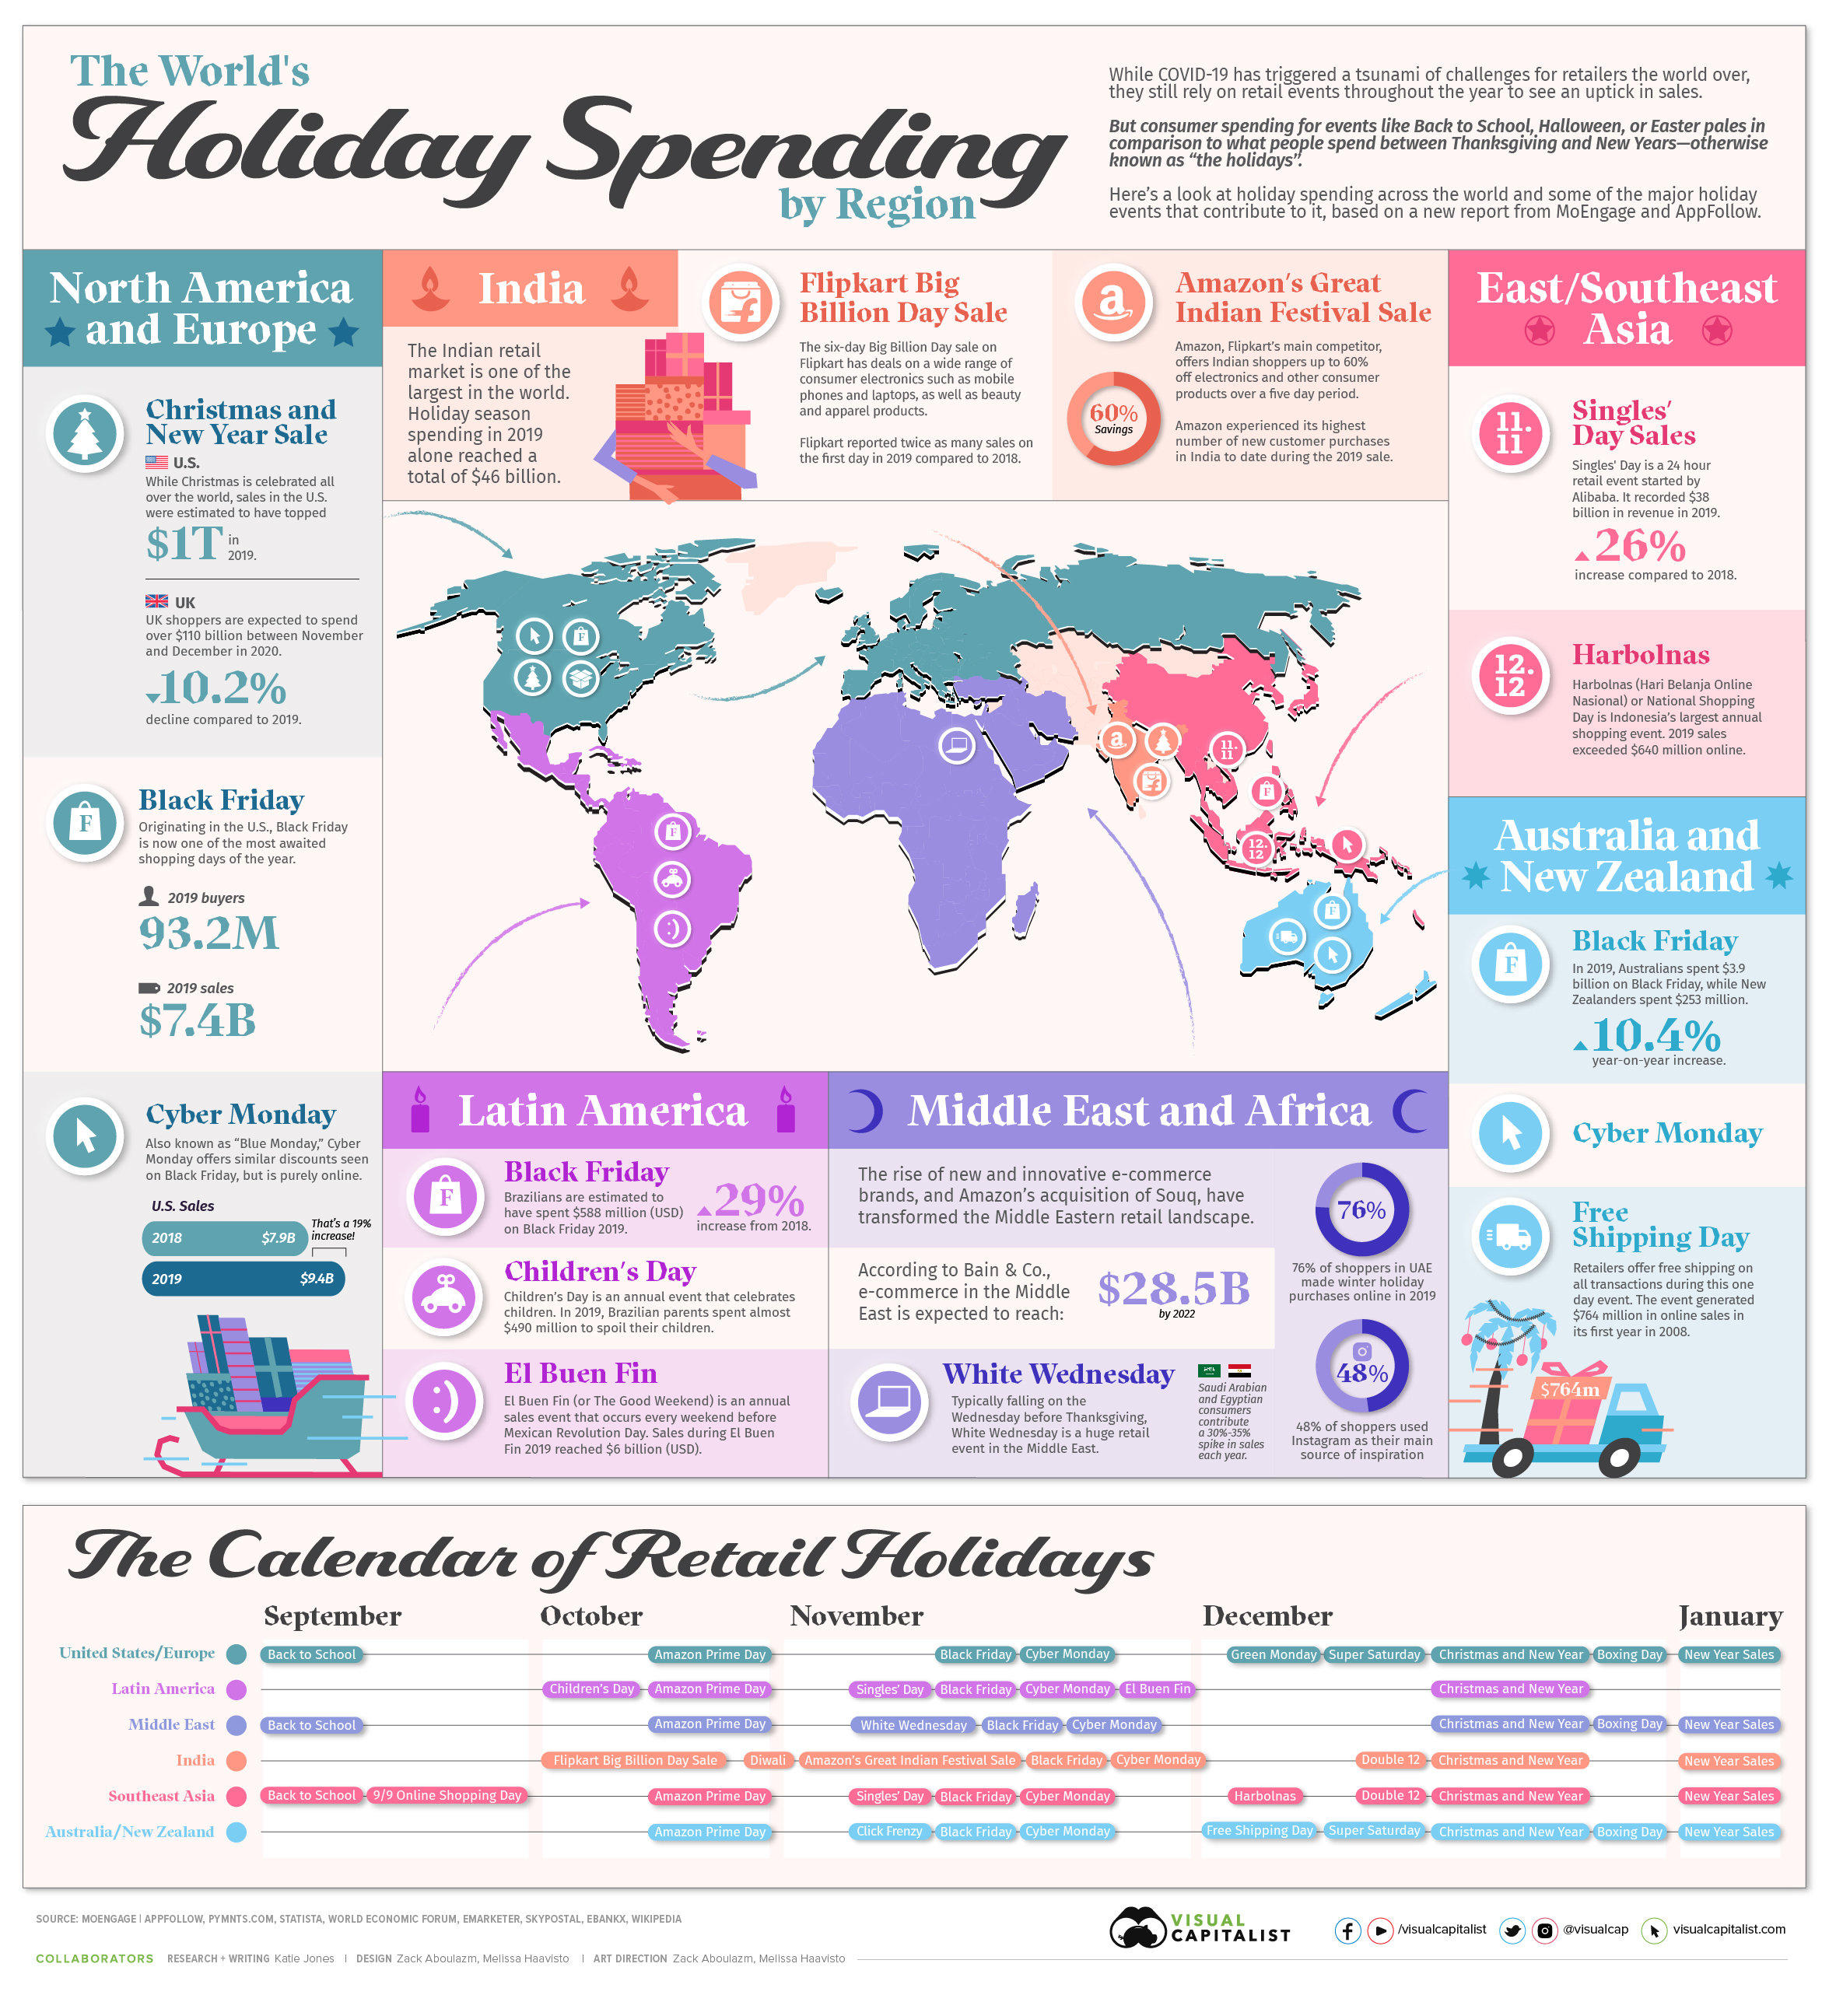
While COVID-19 has triggered a tsunami of challenges for retailers the world over, they can take solace in knowing that retail events throughout the year can contribute to an uptick in sales.
But consumer spending for events like Back to School, Halloween, or Easter pales in comparison to what people spend between Thanksgiving and New Years—otherwise known as “the holidays”.
The graphic above explores holiday spending across the world, as well as some of the major events that contribute to it, based on MoEngage and AppFollow’s Holiday Marketing Guide.
Retail Events by Region
While Christmas is celebrated in some form across most parts of the world, U.S. consumers spend more than any other nation, with retailers raking in an estimated $1 trillion in sales in 2019.
As another major retail holiday, Black Friday originated in the U.S. but has since become a global phenomenon. In 2019, sales for the one day event reached a staggering $7.4 billion in the U.S. alone, but it was surpassed by Cyber Monday, which garnered a total of $9.4 billion in sales.
Over in India, holiday season spending in 2019 reached a total of $46 billion due to a number of events such as Amazon’s Great Indian Festival. Orders were placed during the event from over 99% of India’s postal codes, and on the busiest day, more than 600 flights delivered Amazon orders to customers.
In other parts of Asia, Alibaba’s Singles’ Day is quickly becoming a highly anticipated event attracting attention from consumers in other parts of the world. But while it recorded $38 billion in revenue in 2019, it was meager in comparison to Chinese New Year sales during the same year, which topped $149 billion—although it does not take place during the holiday months covered in this graphic.
2020 Trends Impacting Retailers
Despite many retailers banking on the success of these holiday events, they are up against some critical challenges due to the ongoing COVID-19 pandemic.
Economic Uncertainty
According to the report, consumers have become more cautious about their spending, due to economic uncertainty of their finances. In fact, personal savings rates in the U.S. reached a historic 33% in May of this year.
More Value-Conscious Buyers
It’s no surprise that consumers’ concerns about the economy and their job prospects are affecting how they spend their hard-earned cash. They are spending less on items that may be considered a luxury, and investing more on things that can add value to their lives day-to-day, like media and entertainment.
Reluctance to Shop In-Store
Tightening lockdown restrictions and social distancing have raised some questions around how much of a role brick and mortar stores will play this year for consumers. Interestingly, a study shows that 36% of shoppers now prefer shopping online, up from 28% before the pandemic.
Supply Chain Issues
COVID-19 has wreaked havoc on retail supply chains, resulting in a number of issues arising such as labor shortages and transport restrictions. This has put many retailers under tremendous pressure to reimagine how they can best serve their customers.
The Most Wonderful Time of the Year?
Holiday shopping in 2020 will be anything but typical. Businesses of all shapes and sizes are having to adjust to changing consumer behaviors to ensure they make it through to 2021 intact.
With tightening restrictions across the world, brick and mortar stores are becoming less of an option for millions of people, challenging retailers to focus efforts on their online experience.
Forrester predicts that total retail sales in North America will decline in 2020 overall, while online sales will increase by 18.5%—growth not seen since 2008.
Whether the reimagined supply chains of 2020 can keep up with more online demand is another question.


Brands
Charted: Number of IKEA Stores, by Country
Known for their size, labyrinth-like layouts, food, and of course, functional furniture, IKEA stores have become a whole shopping experience. But which country has the most of them?
Charted: Number of IKEA Stores By Country
This was originally posted on our Voronoi app. Download the app for free on iOS or Android and discover incredible data-driven charts from a variety of trusted sources.
The first IKEA opened in 1958 in Älmhult, Sweden, forever changing how students and young adults on a shoestring budget decorated their homes.
Its mission to provide simple, affordable, and functional furniture to the masses revolutionized an entire industry.
But in which countries does the Scandinavian brand have the biggest presence?
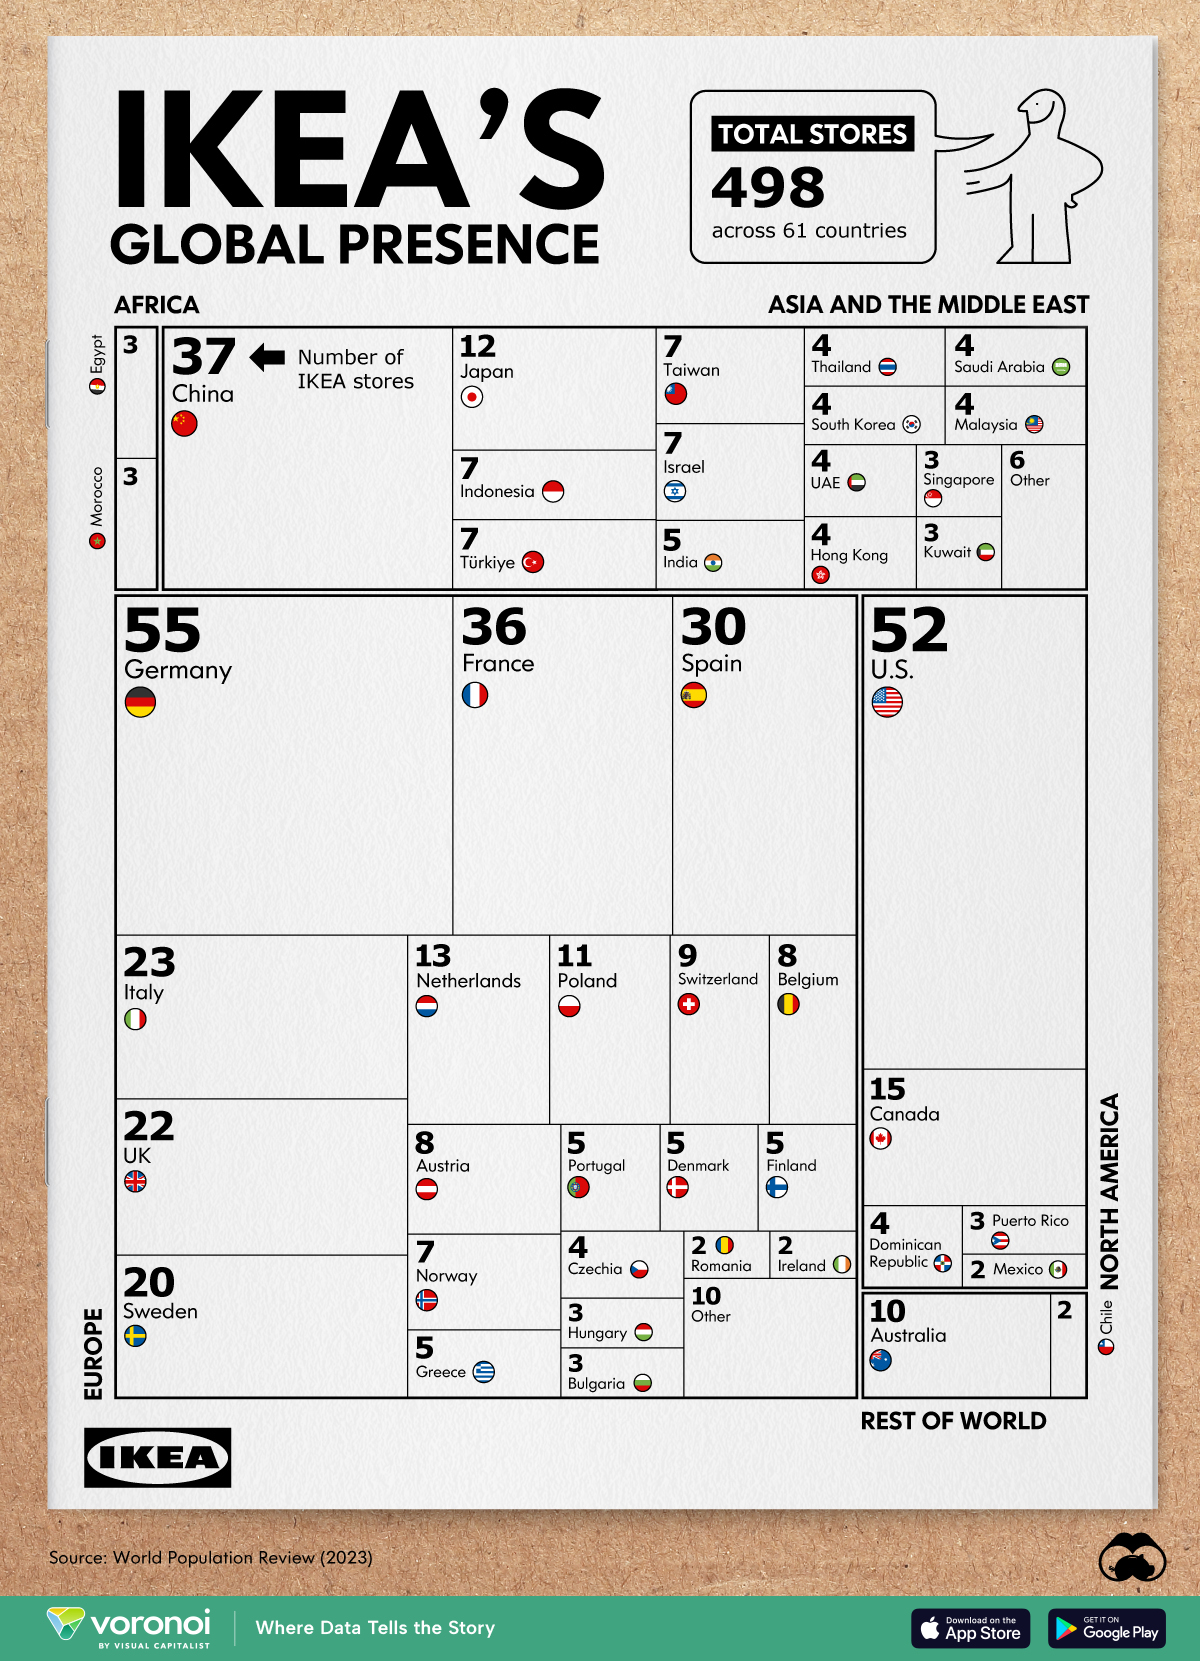
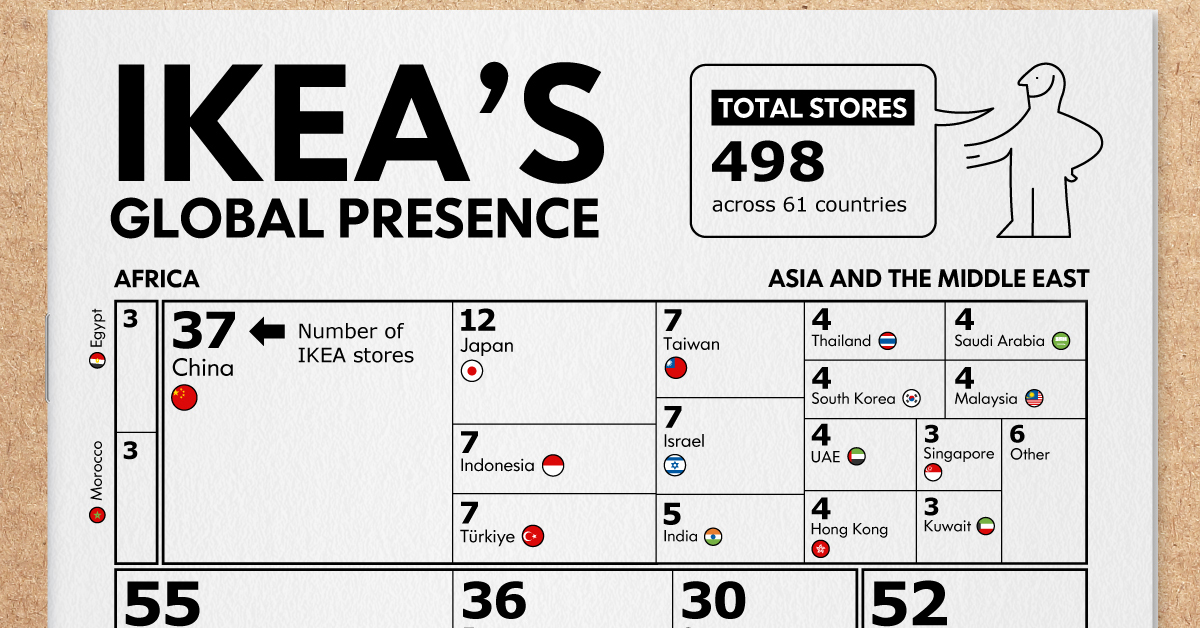
We visualize the number of IKEA stores globally, by region and country, using data from World Population Review. The source warns that per-country numbers tend to fluctuate as stores can open and shut at any time. IKEA’s own store count lists them by region only, and has a lower total number, suggesting stores have closed since World Population Review’s last count.
Which Countries Have the Most IKEA Stores?
IKEA’s biggest presence is in Germany, boasting of 55 stores in a country of 83 million people, or about one store per 1.5 million Germans.
| Rank | Country | Region | Ikea Stores |
|---|---|---|---|
| 1 | 🇩🇪 Germany | Europe | 55 |
| 2 | 🇺🇸 U.S. | North America | 52 |
| 3 | 🇨🇳 China | Asia | 37 |
| 4 | 🇫🇷 France | Europe | 36 |
| 5 | 🇪🇸 Spain | Europe | 30 |
| 6 | 🇮🇹 Italy | Europe | 23 |
| 7 | 🇬🇧 UK | Europe | 22 |
| 8 | 🇸🇪 Sweden | Europe | 20 |
| 9 | 🇨🇦 Canada | North America | 15 |
| 10 | 🇳🇱 Netherlands | Europe | 13 |
| 11 | 🇯🇵 Japan | Asia | 12 |
| 12 | 🇵🇱 Poland | Europe | 11 |
| 13 | 🇦🇺 Australia | Oceania | 10 |
| 14 | 🇨🇭 Switzerland | Europe | 9 |
| 15 | 🇧🇪 Belgium | Europe | 8 |
| 16 | 🇦🇹 Austria | Europe | 8 |
| 17 | 🇮🇩 Indonesia | Asia | 7 |
| 18 | 🇹🇷 Turkey | Asia | 7 |
| 19 | 🇹🇼 Taiwan | Asia | 7 |
| 20 | 🇮🇱 Israel | Asia | 7 |
| 21 | 🇳🇴 Norway | Europe | 7 |
| 22 | 🇮🇳 India | Asia | 5 |
| 23 | 🇬🇷 Greece | Europe | 5 |
| 24 | 🇵🇹 Portugal | Europe | 5 |
| 25 | 🇩🇰 Denmark | Europe | 5 |
| 26 | 🇫🇮 Finland | Europe | 5 |
| 27 | 🇹🇭 Thailand | Asia | 4 |
| 28 | 🇰🇷 South Korea | Asia | 4 |
| 29 | 🇸🇦 Saudi Arabia | Asia | 4 |
| 30 | 🇲🇾 Malaysia | Asia | 4 |
| 31 | 🇦🇪 UAE | Asia | 4 |
| 32 | 🇭🇰 Hong Kong | Asia | 4 |
| 33 | 🇨🇿 Czech Republic | Europe | 4 |
| 34 | 🇩🇴 Dominican Republic | North America | 4 |
| 35 | 🇪🇬 Egypt | Africa | 3 |
| 36 | 🇲🇦 Morocco | Africa | 3 |
| 37 | 🇸🇬 Singapore | Asia | 3 |
| 38 | 🇰🇼 Kuwait | Asia | 3 |
| 39 | 🇭🇺 Hungary | Europe | 3 |
| 40 | 🇧🇬 Bulgaria | Europe | 3 |
| 41 | 🇵🇷 Puerto Rico | North America | 3 |
| 42 | 🇷🇴 Romania | Europe | 2 |
| 43 | 🇮🇪 Ireland | Europe | 2 |
| 44 | 🇲🇽 Mexico | North America | 2 |
| 45 | 🇨🇱 Chile | South America | 2 |
| 46 | 🇵🇭 Philippines | Asia | 1 |
| 47 | 🇯🇴 Jordan | Asia | 1 |
| 48 | 🇴🇲 Oman | Asia | 1 |
| 49 | 🇶🇦 Qatar | Asia | 1 |
| 50 | 🇧🇭 Bahrain | Asia | 1 |
| 51 | 🇲🇴 Macau | Asia | 1 |
| 52 | 🇺🇦 Ukraine | Europe | 1 |
| 53 | 🇷🇸 Serbia | Europe | 1 |
| 54 | 🇸🇰 Slovakia | Europe | 1 |
| 55 | 🇭🇷 Croatia | Europe | 1 |
| 56 | 🇱🇹 Lithuania | Europe | 1 |
| 57 | 🇸🇮 Slovenia | Europe | 1 |
| 58 | 🇱🇻 Latvia | Europe | 1 |
| 59 | 🇪🇪 Estonia | Europe | 1 |
| 60 | 🇨🇾 Cyprus | Europe | 1 |
| 61 | 🇮🇸 Iceland | Europe | 1 |
| N/A | 🌐 World | N/A | 498 |
A 2022 survey found that 96% of Germans knew of the IKEA brand of which 64% actively bought furniture from them. But it’s not only a passion for minimalist home design that Germans enjoy. In 2011, a German newspaper found that IKEA ranked as the second-most popular fast food place in the country, successfully beating out McDonald’s.
Across the Atlantic, the U.S. ranks a close second with 52 IKEA stores, most of them congregating on both coasts, though a fair amount can be found in the Midwest.
Both Germany and the U.S. are well-ahead of the next closest countries, China (37), France (36), and Spain (30), which round out the top five.
Like many other brands seeking access to the 1.4-billion strong market, IKEA has focused on China as a major growth opportunity. It prioritized more modular designs to fit smaller Chinese homes, a sharp contrast to their American consumers who wanted bigger beds and closets.
Some countries in the Middle East and Eastern Europe only have a single store. However, numbers don’t tell the whole story. For example, in Croatia and Lithuania, IKEA is the most-searched brand in the country.
In the Philippines (also with a solitary IKEA), shoppers are treated to a an incredible (or tiring) experience: in Pasay City, the biggest IKEA store ever measures 700,000 square feet, or the equivalent of 150 basketball courts. Before it had even opened, Filipinos reportedly crashed the website in a rush to sign up for loyalty programs.

-

 Misc1 week ago
How Hard Is It to Get Into an Ivy League School?
-

 Technology2 weeks ago
Ranked: Semiconductor Companies by Industry Revenue Share
-

 Markets2 weeks ago
Ranked: The World’s Top Flight Routes, by Revenue
-

 Countries2 weeks ago
Population Projections: The World’s 6 Largest Countries in 2075
-

 Markets2 weeks ago
The Top 10 States by Real GDP Growth in 2023
-

 Demographics2 weeks ago
The Smallest Gender Wage Gaps in OECD Countries
-

 United States2 weeks ago
Where U.S. Inflation Hit the Hardest in March 2024
-

 Green2 weeks ago
Top Countries By Forest Growth Since 2001