

Here are IMF forecasts for global inflation rates up to 2026, highlighting a slow descent of price pressures amid resilient global growth.


Ramadan is the ninth month of the Islamic calendar, observed by Muslims worldwide as a month of fasting, prayer, reflection, and community.


While many inspiring teachings exist about attaining individual happiness, it's worthwhile to consider how happy entire countries are on a collective scale.


China holds the position of both the top importer and exporter with MENA countries by volume.
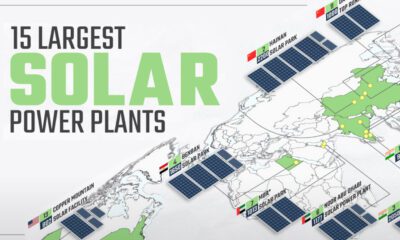

Solar power has grown rapidly over the last decade, and so have solar plants. This map shows the world's 15 largest solar power plants.
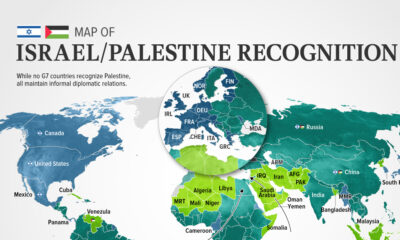

In this visualization, we look at how international recognition of Israel and Palestine breaks down among the 193 UN member states.
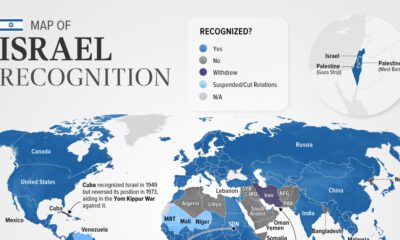

Belize is the latest country to suspend relations with Israel as of November. In this graphic we map the recognition of Israel by country.
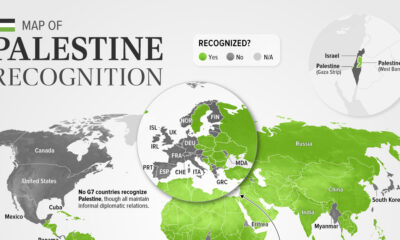

As of November 2023, 138 of the 193 UN members recognized Palestine. This map shows the recognition of the State of Palestine by country.
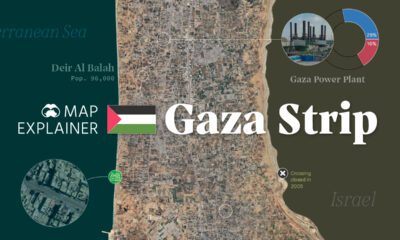

This map explainer looks at the Gaza Strip from a structural point of view, delving into geography, infrastructure, demographics, and more.
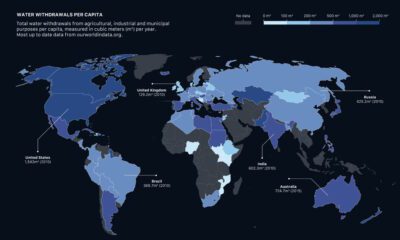

How much water do we have, and which countries use the most? This visual breaks down global water distribution and withdrawals by countries.


 Creator Program