Maps
Where are the World’s Largest Solar Power Plants?
Article/Editing:
Visualizing the World’s Largest Solar Power Plants
Devastating wildfires, rising temperatures, and warming seas across the world have added renewed vigor to the global quest for carbon emission reductions.
And in this hunt for sustainable alternatives to air-polluting energy sources, solar power plants have emerged as shining beacons of hope.
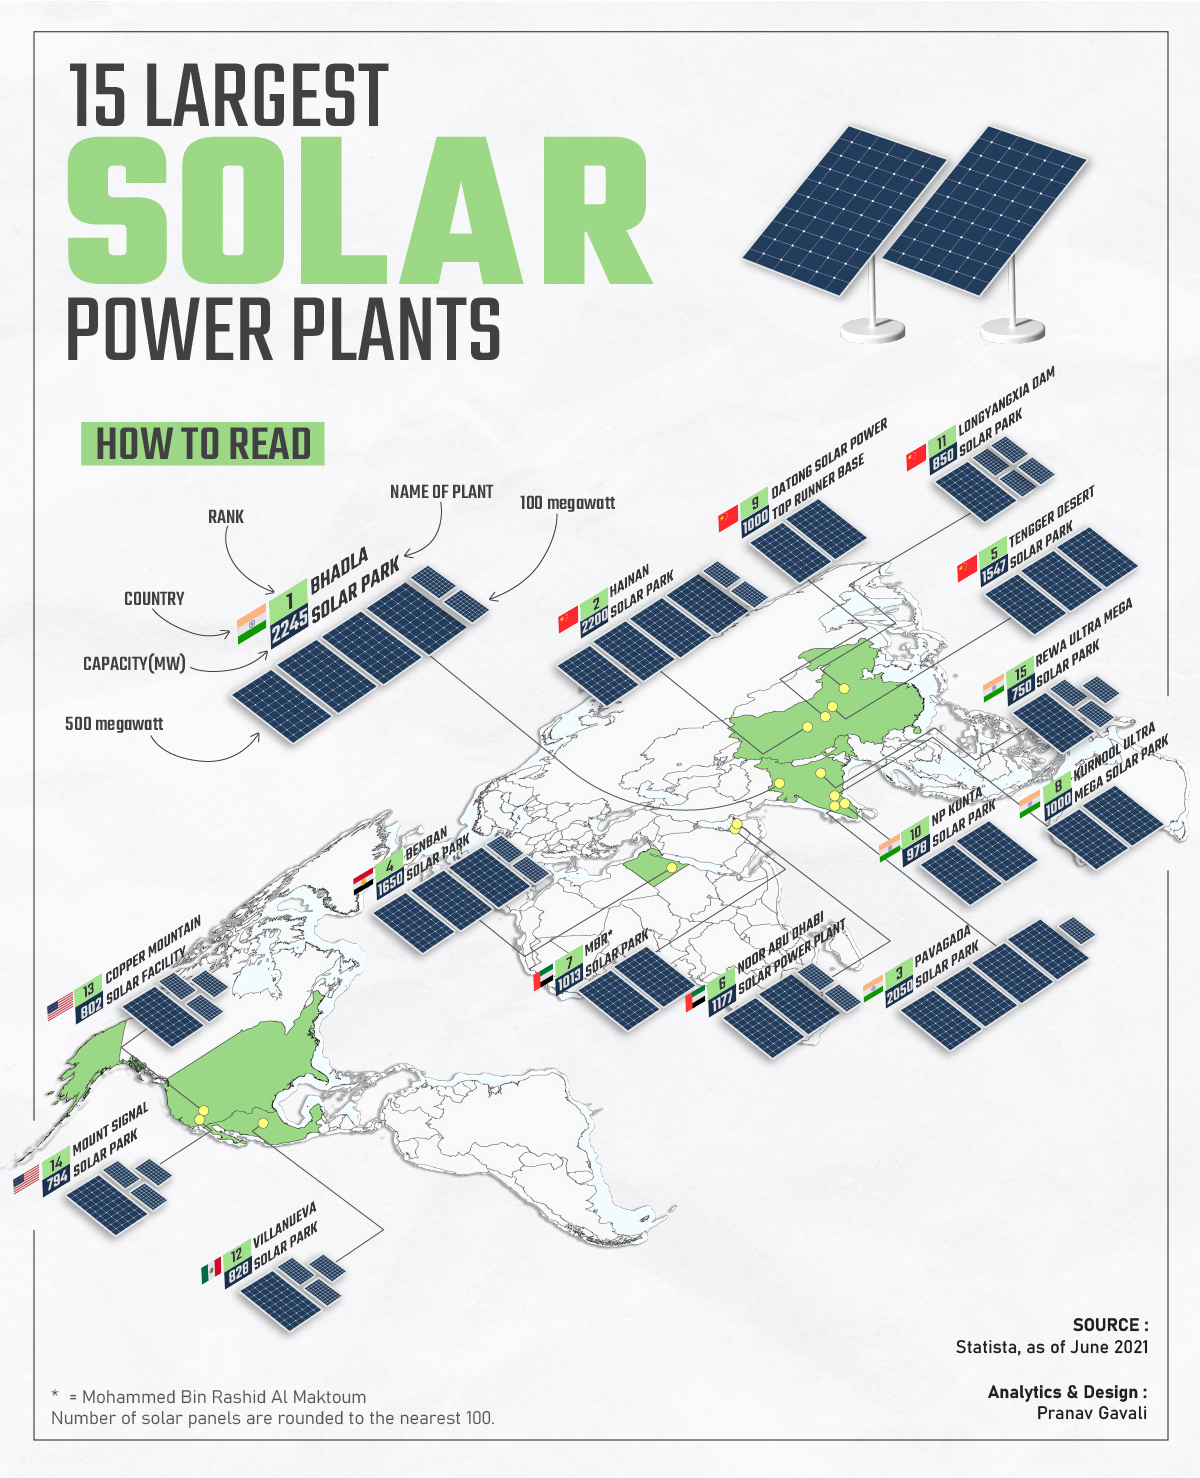
In this graphic, Pranav Gavali uses data from Statista to shed light on the world’s 15 largest solar power plants (and solar parks) illuminating the world as of 2021.
World’s Largest Solar Power Plants By Capacity
Solar power plants have been harnessing the sun’s abundant rays over the past two decades, but plants with capacities in the thousands of megawatts have only come online within the last few years.
And two countries have been leading their rollout: China and India. Together they housed nine of the 15 largest solar power plants in the world in 2021.
Here are the top 15 solar power plants (photovoltaic power stations) by installed capacity:
| Rank | Name | Country | Capacity |
|---|---|---|---|
| 1 | Bhadla Solar Park | 🇮🇳 India | 2,245 MW |
| 2 | Huanghe Hydropower Hainan Solar Park | 🇨🇳 China | 2,200 MW |
| 3 | Pavagada Solar Park | 🇮🇳 India | 2,050 MW |
| 4 | Benban Solar Park | 🇪🇬 Egypt | 1,650 MW |
| 5 | Tengger Desert Solar Park | 🇨🇳 China | 1,547 MW |
| 6 | Noor Abu Dhabi | 🇦🇪 UAE | 1,177 MW |
| 7 | Mohammed Bin Rashid Al Maktoum Solar Park | 🇦🇪 UAE | 1,013 MW |
| 8 | Kurnool Ultra Mega Solar Park | 🇮🇳 India | 1,000 MW |
| 9 | Datong Solar Power Top Runner Base | 🇨🇳 China | 1,000 MW |
| 10 | NP Kunta | 🇮🇳 India | 978 MW |
| 11 | Longyangxia Dam Solar Park | 🇨🇳 China | 850 MW |
| 12 | Villanueva Solar Park | 🇲🇽 Mexico | 828 MW |
| 13 | Copper Mountain Solar Facility | 🇺🇸 United States | 802 MW |
| 14 | Mount Signal Solar Park | 🇺🇸 United States | 794 MW |
| 15 | Rewa Ultra Mega Solar Park | 🇮🇳 India | 750 MW |
India’s Bhadla Solar Park is the world’s largest solar park as of the time of the dataset. It has the capacity to generate 2,245 megawatts of electricity alone, enough to power 1.3 million homes. The country also has the third-largest solar power plant, Pavagada Solar Park, and five of the top 15.
China is the world’s largest producer of solar energy and had four of the 15 largest solar plants in 2021. Huanghe Hydropower’s Hainan Solar Park—listed in some sources as Golmud Solar Park—is the world’s second largest solar power plant with a 2,200 megawatt capacity, while Tengger Desert Solar Park (also known as the “Great Wall of Solar”) was formerly the largest solar park in the world with a 1,547 megawatt capacity.
One thing the world’s largest solar power plants have in common is access to large stretches of open land, particularly deserts. And three of the newest mega solar parks are in the Middle East: Egypt’s Benban Solar Park, and UAE’s Mohammed bin Rashid Al Maktoum Solar Park and Noor Abu Dhabi Solar Power Plant.
Solar energy usage has been growing exponentially across the Atlantic as well, just not as fast as in Asia. Mexico’s Villanueva Solar Park is the largest solar plant in the Americas with an 828 megawatt capacity, while the Copper Mountain Solar Facility (802 MW) in Nevada and the Mount Signal Solar Park (794 MW) in California are the largest plants in the United States.

This article was published as a part of Visual Capitalist's Creator Program, which features data-driven visuals from some of our favorite Creators around the world.


Maps
The Largest Earthquakes in the New York Area (1970-2024)
The earthquake that shook buildings across New York in April 2024 was the third-largest quake in the Northeast U.S. over the past 50 years.


The Largest Earthquakes in the New York Area
This was originally posted on our Voronoi app. Download the app for free on Apple or Android and discover incredible data-driven charts from a variety of trusted sources.
The 4.8 magnitude earthquake that shook buildings across New York on Friday, April 5th, 2024 was the third-largest quake in the U.S. Northeast area over the past 50 years.
In this map, we illustrate earthquakes with a magnitude of 4.0 or greater recorded in the Northeastern U.S. since 1970, according to the United States Geological Survey (USGS).
Shallow Quakes and Older Buildings
The earthquake that struck the U.S. Northeast in April 2024 was felt by millions of people from Washington, D.C., to north of Boston. It even caused a full ground stop at Newark Airport.
The quake, occurring just 5 km beneath the Earth’s surface, was considered shallow, which is what contributed to more intense shaking at the surface.
According to the USGS, rocks in the eastern U.S. are significantly older, denser, and harder than those on the western side, compressed by time. This makes them more efficient conduits for seismic energy. Additionally, buildings in the Northeast tend to be older and may not adhere to the latest earthquake codes.
Despite disrupting work and school life, the earthquake was considered minor, according to the Michigan Technological University magnitude scale:
| Magnitude | Earthquake Effects | Estimated Number Each Year |
|---|---|---|
| 2.5 or less | Usually not felt, but can be recorded by seismograph. | Millions |
| 2.5 to 5.4 | Often felt, but only causes minor damage. | 500,000 |
| 5.5 to 6.0 | Slight damage to buildings and other structures. | 350 |
| 6.1 to 6.9 | May cause a lot of damage in very populated areas. | 100 |
| 7.0 to 7.9 | Major earthquake. Serious damage. | 10-15 |
| 8.0 or greater | Great earthquake. Can totally destroy communities near the epicenter. | One every year or two |
The largest earthquake felt in the area over the past 50 years was a 5.3 magnitude quake that occurred in Au Sable Forks, New York, in 2002. It damaged houses and cracked roads in a remote corner of the Adirondack Mountains, but caused no injuries.
| Date | Magnitude | Location | State |
|---|---|---|---|
| April 20, 2002 | 5.3 | Au Sable Forks | New York |
| October 7, 1983 | 5.1 | Newcomb | New York |
| April 5, 2024 | 4.8 | Whitehouse Station | New Jersey |
| October 16, 2012 | 4.7 | Hollis Center | Maine |
| January 16, 1994 | 4.6 | Sinking Spring | Pennsylvania |
| January 19, 1982 | 4.5 | Sanbornton | New Hampshire |
| September 25, 1998 | 4.5 | Adamsville | Pennsylvania |
| June 9, 1975 | 4.2 | Altona | New York |
| May 29, 1983 | 4.2 | Peru | Maine |
| April 23, 1984 | 4.2 | Conestoga | Pennsylvania |
| January 16, 1994 | 4.2 | Sinking Spring | Pennsylvania |
| November 3, 1975 | 4 | Long Lake | New York |
| June 17, 1991 | 4 | Worcester | New York |
The largest earthquake in U.S. history, however, was the 1964 Good Friday quake in Alaska, measuring 9.2 magnitude and killing 131 people.

-

 Debt1 week ago
How Debt-to-GDP Ratios Have Changed Since 2000
-

 Countries2 weeks ago
Population Projections: The World’s 6 Largest Countries in 2075
-

 Markets2 weeks ago
The Top 10 States by Real GDP Growth in 2023
-

 Demographics2 weeks ago
The Smallest Gender Wage Gaps in OECD Countries
-

 United States2 weeks ago
Where U.S. Inflation Hit the Hardest in March 2024
-

 Green2 weeks ago
Top Countries By Forest Growth Since 2001
-

 United States2 weeks ago
Ranked: The Largest U.S. Corporations by Number of Employees
-

 Maps2 weeks ago
The Largest Earthquakes in the New York Area (1970-2024)