Environment
Understanding the Global Supply of Water
Article/Editing:
Understanding the Global Supply of Water
As the world’s population and its agricultural needs have grown, so too has the demand for water, putting the world’s supply of water under the microscope.
A century ago, freshwater consumption was six times lower than in modern times. This increase in demand and usage has resulted in rising stress on freshwater resources and further depletion of reservoirs.
This graphic by Chesca Kirkland uses insights from Our World in Data to break down water supply and also withdrawals per capita. The latter measures the quantity of water taken from both groundwater and freshwater sources for agricultural, industrial, or domestic use.
How Much Water Do We Have?
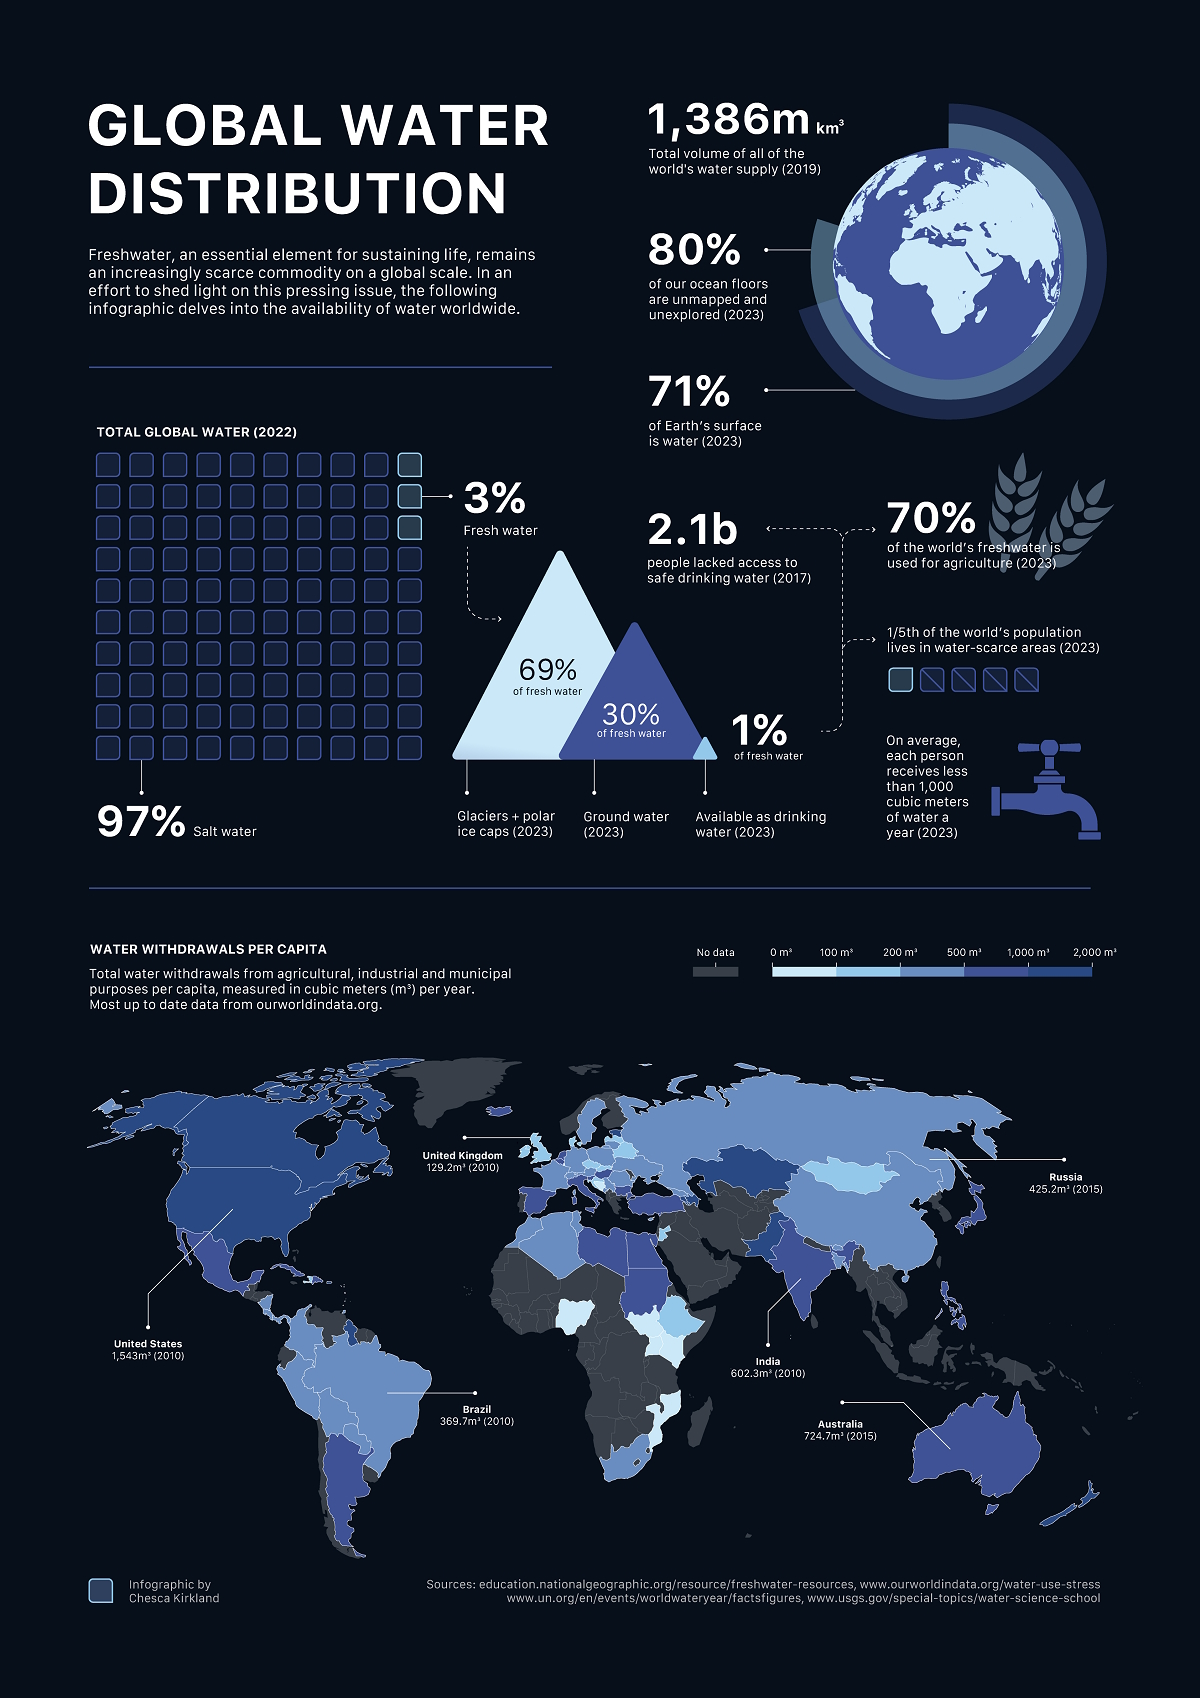
Many people know that more than 70% of the Earth’s surface is water. That’s 326 million trillion gallons of water, yet humanity still faces a tight supply. Why is that?
It’s because 97% of this water is saline and unfit for consumption. Of the remaining 3% of freshwater, about two-thirds are locked away in the form of snow, glaciers, and polar ice caps. Meanwhile, just under a third of freshwater is found in fast-depleting groundwater resources.
That leaves just 1% of global freshwater as “easily” sourced supply from rainfall as well as freshwater reservoirs including rivers and lakes.
Per Capita Water Withdrawals
Any look at a world map of rivers and lakes will reveal that fresh water distribution is highly uneven across different regions of the world.
Yet developed and developing countries alike require a lot of water for both commercial and personal use. Agriculture use alone accounts for an estimated 70% of the world’s available freshwater.
Below we can see how water withdrawals per capita have grown over the past decades, using the latest available data from each.
Many of the countries with the largest water withdrawals per capita are located in the arid deserts of Central Asia, including top-ranked Turkmenistan at 5,753 cubic meters of annual water withdrawals per person in 2005.
And for developing countries with high water usage, from Turkmenistan to Guyana, most of their water withdrawals are for agriculture. For example, an estimated 95% of available water in Turkmenistan goes towards agriculture.
Developed nations like Finland, New Zealand and the U.S. also withdraw tons of water, at more than 1,000 cubic meters annually per person, but their uses are notably different. In the United States, for example, 41% of water withdrawals in 2015 went to thermoelectric power generation, while 37% went towards irrigation and livestock. For Finland, on the other hand, 80% of water was used for industrial production.
Most of the countries with lower water withdrawals per capita, meanwhile, are concentrated in Africa. They include very populated countries, such as Nigeria and Kenya, which both withdrew around 75 cubic meters of water per person in 2015 and 2010 respectively. This also highlights the continent’s water accessibility and infrastructure issues.
Bridging the Water Inequity Gap
Over the years, various initiatives have emerged to mitigate the world’s water inequality gap.
Efforts include promoting water conservation practices, investing in efficient irrigation systems, and enhancing water infrastructure in regions most affected by scarcity.
Some nations in arid climates with coastal access, such as Saudi Arabia, are also converting ocean salt water to fresh water through desalination plants.


This article was published as a part of Visual Capitalist's Creator Program, which features data-driven visuals from some of our favorite Creators around the world.


Green
Top Countries By Forest Growth Since 2001
One country is taking reforestation very seriously, registering more than 400,000 square km of forest growth in two decades.
Ranked: Top Countries By Forest Growth Since 2001
This was originally posted on our Voronoi app. Download the app for free on Apple or Android and discover incredible data-driven charts from a variety of trusted sources.
Reforestation is tricky business: it’s expensive, difficult to plan, and even harder to execute. And this is without all the associated environmental obstacles: weather, pests, and natural calamities.
However, some countries have prioritized replanting their lost forests, especially in the last two decades as the climate movement has gathered steam.
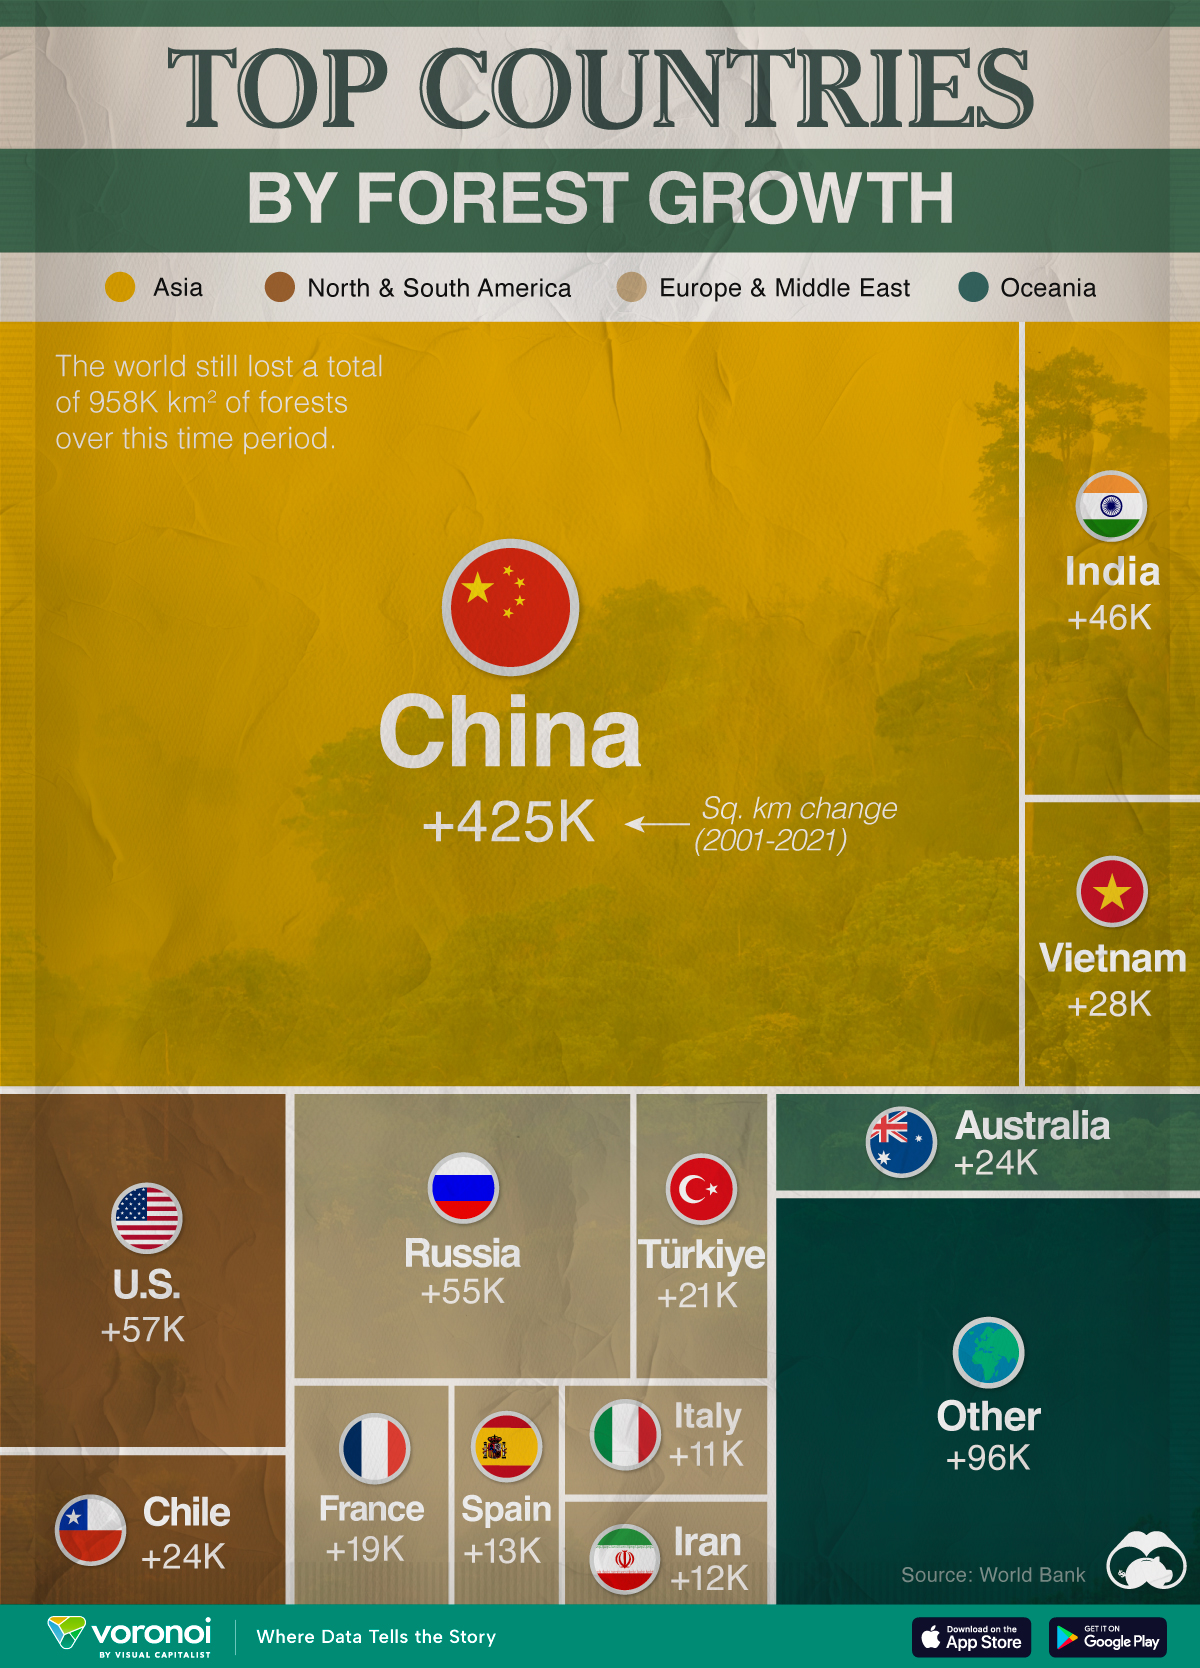
We visualized forest growth around the world, ranking countries by their forest area increases between 2001–2021, measured in square kilometers (km²).
All of this data was sourced from the World Bank. Note that countries are ranked by forest growth in square kilometers, rather than percentage change.
Which Country Leads Forest Growth Since 2001?
China tops the list, expanding its forest area by nearly 425,000 km2 (roughly the size of Sweden) between 2001–21. This is more than the next 19 countries combined. Relatively speaking, China’s forests increased by almost one-fourth.
| Rank | Country | Region | 2001–21 Change (Km2) | % of Forest Growth |
|---|---|---|---|---|
| 1 | 🇨🇳 China | Asia | 424,962 | 24% |
| 2 | 🇺🇸 U.S. | North America | 57,406 | 2% |
| 3 | 🇷🇺 Russia | Europe | 54,564 | 1% |
| 4 | 🇮🇳 India | Asia | 46,449 | 7% |
| 5 | 🇻🇳 Vietnam | Asia | 27,745 | 23% |
| 6 | 🇨🇱 Chile | South America | 24,257 | 15% |
| 7 | 🇦🇺 Australia | Oceania | 24,178 | 2% |
| 8 | 🇹🇷 Turkiye | Middle East | 21,345 | 11% |
| 9 | 🇫🇷 France | Europe | 19,353 | 13% |
| 10 | 🇪🇸 Spain | Europe | 13,374 | 8% |
| 11 | 🇮🇷 Iran | Middle East | 13,033 | 14% |
| 12 | 🇮🇹 Italy | Europe | 11,848 | 14% |
| 13 | 🇨🇺 Cuba | Central America | 7,573 | 30% |
| 14 | 🇹🇭 Thailand | Asia | 7,315 | 4% |
| 15 | 🇺🇿 Uzbekistan | Asia | 7,152 | 24% |
| 16 | 🇺🇾 Uruguay | South America | 6,468 | 46% |
| 17 | 🇷🇴 Romania | Europe | 5,482 | 9% |
| 18 | 🇧🇬 Bulgaria | Europe | 4,948 | 15% |
| 19 | 🇧🇾 Belarus | Europe | 4,734 | 6% |
| 20 | 🇵🇱 Poland | Europe | 4,090 | 5% |
| N/A | 🌍 World | -957,658 | -2% |
There are some other countries who have achieved similar relative levels of reforestation. Within Asia, Vietnam’s forests as a percentage of total land area have doubled since 1990. Since 2001, its forests have grown nearly 28,000 km², a 23% increase.
Uzbekistan similarly expanded its forested area by 24%, which amounts to about 7,000 km².
Meanwhile, Chile and Uruguay, are the only two South American countries that have managed to expand their forest cover in the last two decades—the latter by a staggering 46%. In contrast, the rest of South America is instead seeing significant deforestation.
It’s interesting to note that reforestation also comes with its own risks. Introducing non-native or monoculture tree species can reduce biodiversity and lead to soil erosion.
And despite global reforestation efforts, the world still lost close to a million square kilometers of forests since 2001.

-

 Debt1 week ago
How Debt-to-GDP Ratios Have Changed Since 2000
-

 Markets2 weeks ago
Ranked: The World’s Top Flight Routes, by Revenue
-

 Countries2 weeks ago
Population Projections: The World’s 6 Largest Countries in 2075
-

 Markets2 weeks ago
The Top 10 States by Real GDP Growth in 2023
-

 Demographics2 weeks ago
The Smallest Gender Wage Gaps in OECD Countries
-

 United States2 weeks ago
Where U.S. Inflation Hit the Hardest in March 2024
-

 Green2 weeks ago
Top Countries By Forest Growth Since 2001
-

 United States2 weeks ago
Ranked: The Largest U.S. Corporations by Number of Employees