Africa
Visualizing the Water Accessibility Divide in Sub-Saharan Africa
Article/Editing:
Visualizing the Water Accessibility Divide in Sub-Saharan Africa
According to the United Nations, having access to safe drinking water is a universal human right.
Yet, in Sub-Saharan Africa, only 39% of the population has water connected to their homes—and in the region’s rural areas, this figure drops to just 19%.
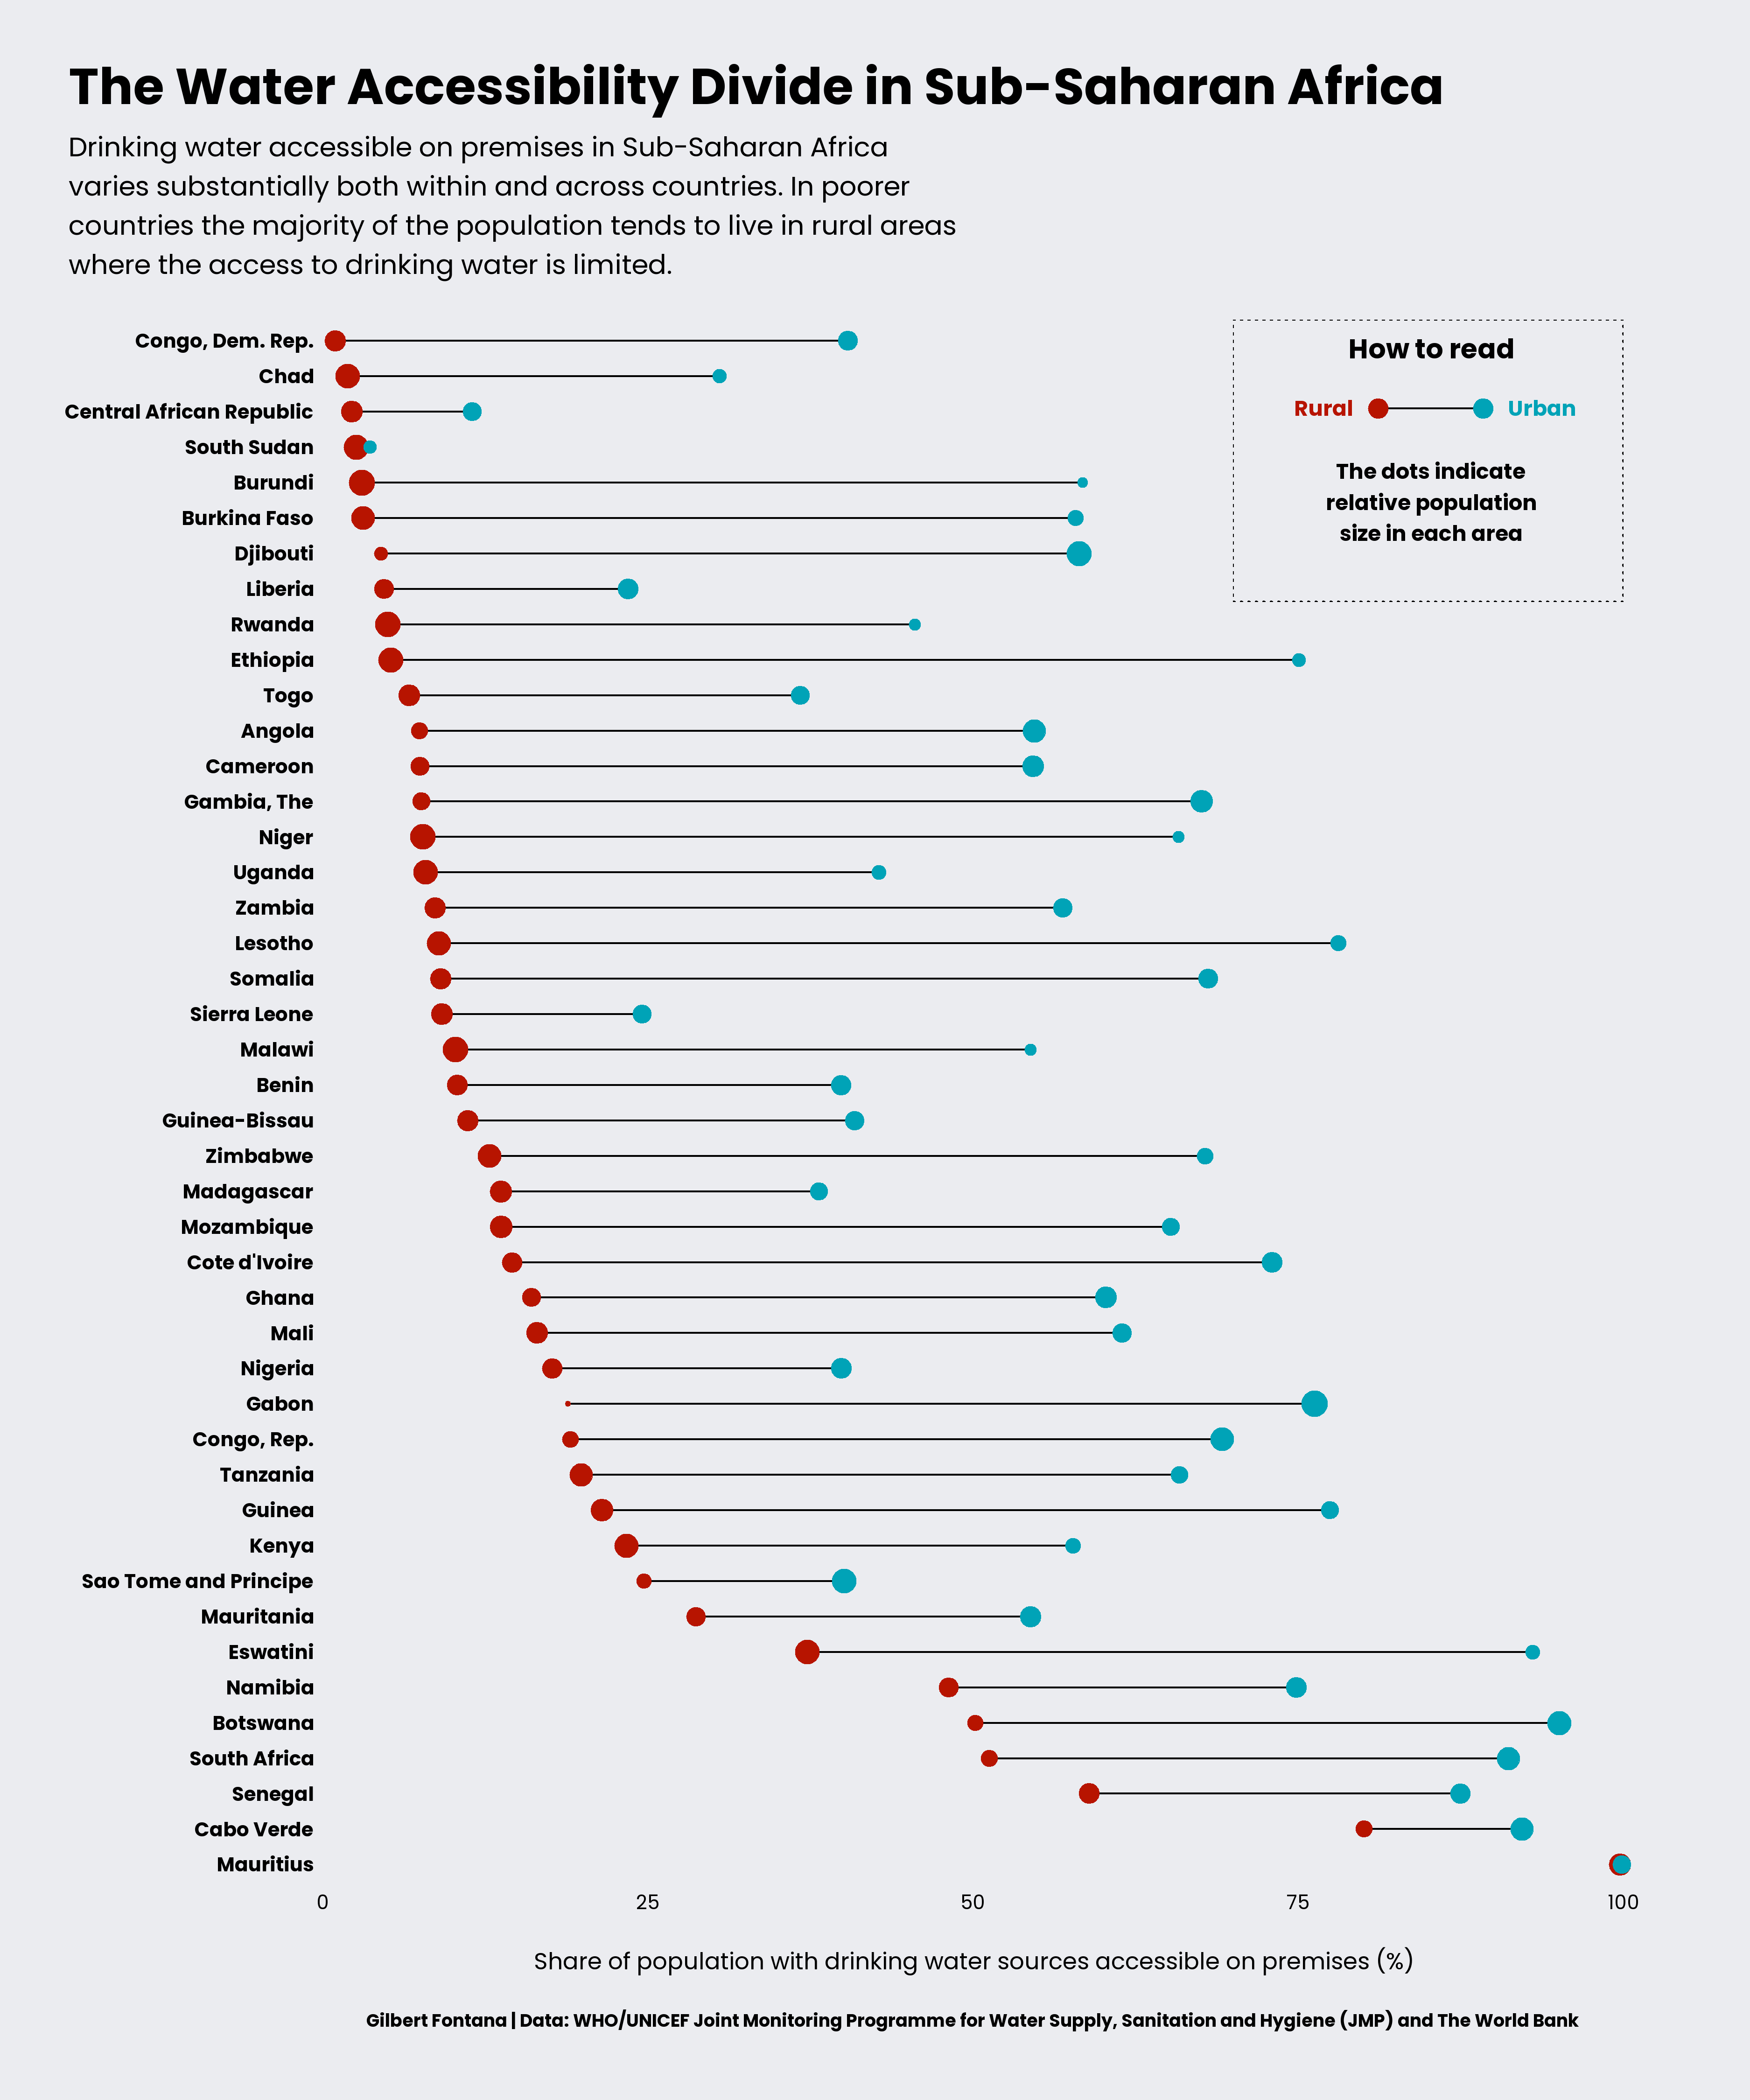
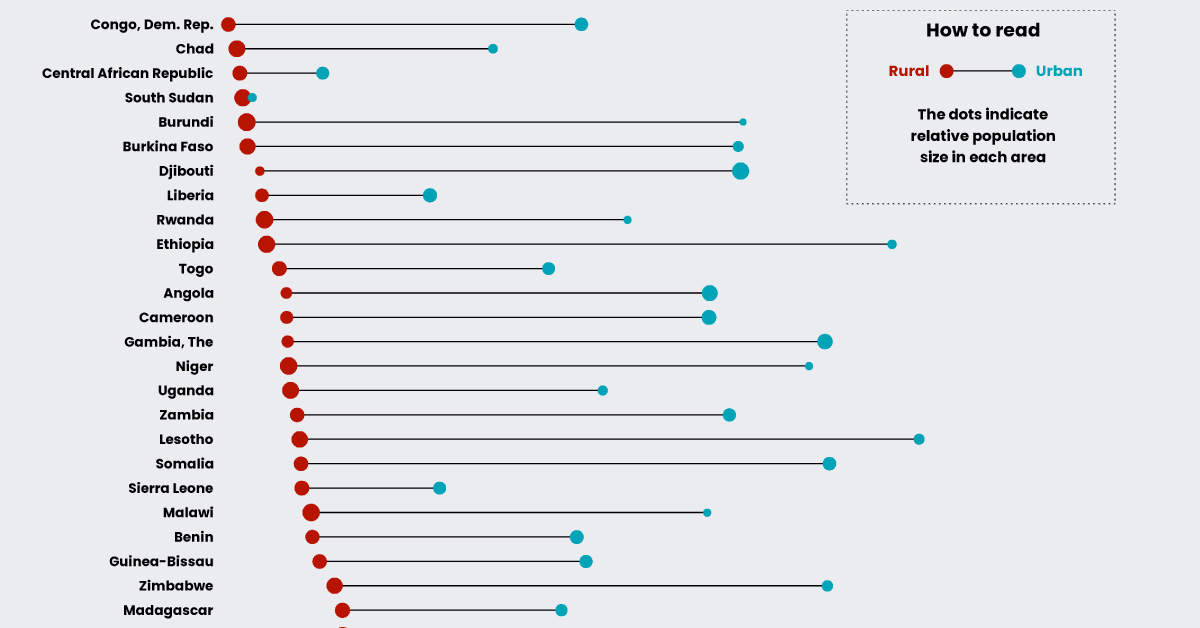
This graphic by Gilbert Fontana uses data from the United Nations to compare water accessibility in different countries across Sub-Saharan Africa. The data specifically looks at water on-premises, which is defined as water that’s connected to a person’s dwelling.
The Water Accessibility Gap
In Sub-Saharan Africa, water accessibility varies greatly both within and across countries.
For example, Ethiopia has one of the widest gaps within a single country—while 75% of its urban population has access to on-premises water, only 5% of its rural population has water piped to their homes.
While it is one of the most populated countries in Africa, with more than 115 million people as of 2020, Ethiopia is also one of the poorest. It has a national income per capita of only $890, and about 20% of Ethiopia’s population lives in rural areas of the country, leaving about 4.5 million people without access to on-premises water.
Here’s a breakdown of water access in other countries across Sub-Saharan Africa:
| Country | Population Type | % of population with drinking water on premises (2020) |
|---|---|---|
| 🇲🇺 Mauritius | Urban | 99.9% |
| 🇲🇺 Mauritius | Rural | 99.8% |
| 🇦🇴 Angola | Urban | 54.7% |
| 🇦🇴 Angola | Rural | 7.5% |
| 🇧🇯 Benin | Urban | 39.9% |
| 🇧🇯 Benin | Rural | 10.4% |
| 🇧🇼 Botswana | Urban | 95.1% |
| 🇧🇼 Botswana | Rural | 50.2% |
| 🇧🇫 Burkina Faso | Urban | 57.9% |
| 🇧🇫 Burkina Faso | Rural | 3.1% |
| 🇧🇮 Burundi | Urban | 58.5% |
| 🇧🇮 Burundi | Rural | 3.0% |
| 🇨🇲 Cameroon | Urban | 54.7% |
| 🇨🇲 Cameroon | Rural | 7.5% |
| 🇨🇻 Cape Verde | Urban | 92.2% |
| 🇨🇻 Cape Verde | Rural | 80.1% |
| 🇨🇫 Central African Republic | Urban | 11.5% |
| 🇨🇫 Central African Republic | Rural | 2.3% |
| 🇹🇩 Chad | Urban | 30.5% |
| 🇹🇩 Chad | Rural | 2.0% |
| 🇨🇮 Côte d'Ivoire | Urban | 73.0% |
| 🇨🇮 Côte d'Ivoire | Rural | 14.6% |
| 🇨🇩 Democratic Republic of the Congo | Urban | 40.4% |
| 🇨🇩 Democratic Republic of the Congo | Rural | 1.0% |
| 🇩🇯 Djibouti | Urban | 58.2% |
| 🇩🇯 Djibouti | Rural | 4.5% |
| 🇸🇿 Eswatini | Urban | 93.1% |
| 🇸🇿 Eswatini | Rural | 37.3% |
| 🇪🇹 Ethiopia | Urban | 75.1% |
| 🇪🇹 Ethiopia | Rural | 5.2% |
| 🇬🇦 Gabon | Urban | 76.3% |
| 🇬🇦 Gabon | Rural | 18.9% |
| 🇬🇭 Ghana | Urban | 60.3% |
| 🇬🇭 Ghana | Rural | 16.1% |
| 🇬🇳 Guinea | Urban | 77.5% |
| 🇬🇳 Guinea | Rural | 21.5% |
| 🇬🇼 Guinea-Bissau | Urban | 40.9% |
| 🇬🇼 Guinea-Bissau | Rural | 4.7% |
| 🇰🇪 Kenya | Urban | 57.7% |
| 🇰🇪 Kenya | Rural | 23.4% |
| 🇱🇸 Lesotho | Urban | 78.1% |
| 🇱🇸 Lesotho | Rural | 8.9% |
| 🇱🇷 Liberia | Urban | 23.5% |
| 🇱🇷 Liberia | Rural | 4.8% |
| 🇲🇬 Madagascar | Urban | 38.2% |
| 🇲🇬 Madagascar | Rural | 13.7% |
| 🇲🇼 Malawi | Urban | 54.4% |
| 🇲🇼 Malawi | Rural | 10.2% |
| 🇲🇱 Mali | Urban | 61.5% |
| 🇲🇱 Mali | Rural | 16.5% |
| 🇲🇷 Mauritania | Urban | 54.4% |
| 🇲🇷 Mauritania | Rural | 28.7% |
| 🇲🇿 Mozambique | Urban | 65.2% |
| 🇲🇿 Mozambique | Rural | 13.7% |
| 🇳🇦 Namibia | Urban | 74.9% |
| 🇳🇦 Namibia | Rural | 48.2% |
| 🇳🇪 Niger | Urban | 65.8% |
| 🇳🇪 Niger | Rural | 7.7% |
| 🇳🇬 Nigeria | Urban | 39.9% |
| 🇳🇬 Nigeria | Rural | 17.7% |
| 🇨🇬 Republic of the Congo | Urban | 69.2% |
| 🇨🇬 Republic of the Congo | Rural | 19.1% |
| 🇷🇼 Rwanda | Urban | 45.5% |
| 🇷🇼 Rwanda | Rural | 5.0% |
| 🇸🇹 São Tomé and Príncipe | Urban | 40.1% |
| 🇸🇹 São Tomé and Príncipe | Rural | 24.7% |
| 🇸🇳 Senegal | Urban | 87.5% |
| 🇸🇳 Senegal | Rural | 59.0% |
| 🇸🇱 Sierra Leone | Urban | 24.6% |
| 🇸🇱 Sierra Leone | Rural | 9.2% |
| 🇸🇴 Somalia | Urban | 68.1% |
| 🇸🇴 Somalia | Rural | 9.1% |
| 🇿🇦 South Africa | Urban | 91.2% |
| 🇿🇦 South Africa | Rural | 51.3% |
| 🇸🇸 South Sudan | Urban | 3.7% |
| 🇸🇸 South Sudan | Rural | 2.6% |
| 🇹🇿 Tanzania | Urban | 65.9% |
| 🇹🇿 Tanzania | Rural | 19.9% |
| 🇬🇲 The Gambia | Urban | 67.6% |
| 🇬🇲 The Gambia | Rural | 7.6% |
| 🇹🇬 Togo | Urban | 36.8% |
| 🇹🇬 Togo | Rural | 6.7% |
| 🇺🇬 Uganda | Urban | 42.8% |
| 🇺🇬 Uganda | Rural | 8.0% |
| 🇿🇲 Zambia | Urban | 56.9% |
| 🇿🇲 Zambia | Rural | 8.6% |
| 🇿🇼 Zimbabwe | Urban | 67.9% |
| 🇿🇼 Zimbabwe | Rural | 12.9% |
As the table above shows, the rural population in the Democratic Republic of the Congo (DRC) is facing some of the worst water scarcity issues across the region, with less than 1% of its rural population having access to on-premises water.
This is particularly worrisome because the DRC has the most fresh-water resources of any country in Africa.
Yet, due to poor infrastructure and conflict-related damage to facilities, hundreds of thousands of people in the DRC do not have safe running water in their homes.
What’s the Impact on the Population?
Without water connected to their homes, people have no choice but to walk to the nearest water source, to collect and carry it back to their homes.
Often, the burden of collecting water falls onto women and children, which can impact their access to education and opportunities to study.
In Chad, where 2% of the rural population has running water in their homes, female literacy rates sit at 14%. According to data from UNESCO, more than 700,000 children weren’t in school in 2019, and of those children, almost 500,000 were female.

This article was published as a part of Visual Capitalist's Creator Program, which features data-driven visuals from some of our favorite Creators around the world.


Africa
Mapped: Breaking Down the $3 Trillion African Economy by Country
The top three economic powerhouses of Africa contribute more than one-third to the African economy. We rank the nations of the world’s second-largest continent by 2024 GDP estimates.
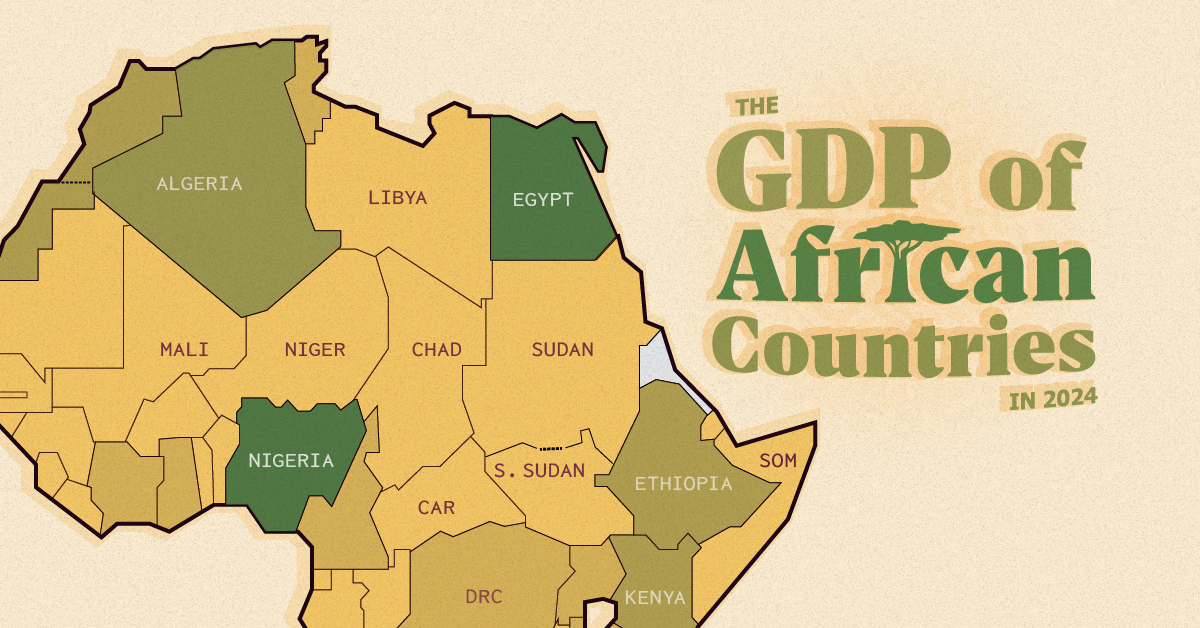
Breaking Down the $3 Trillion African Economy by Country
This was originally posted on our Voronoi app. Download the app for free on iOS or Android and discover incredible data-driven charts from a variety of trusted sources.
Home to 1.4 billion people, the nations of the African continent are widely diverse; not just in culture and language, but also in economic output.
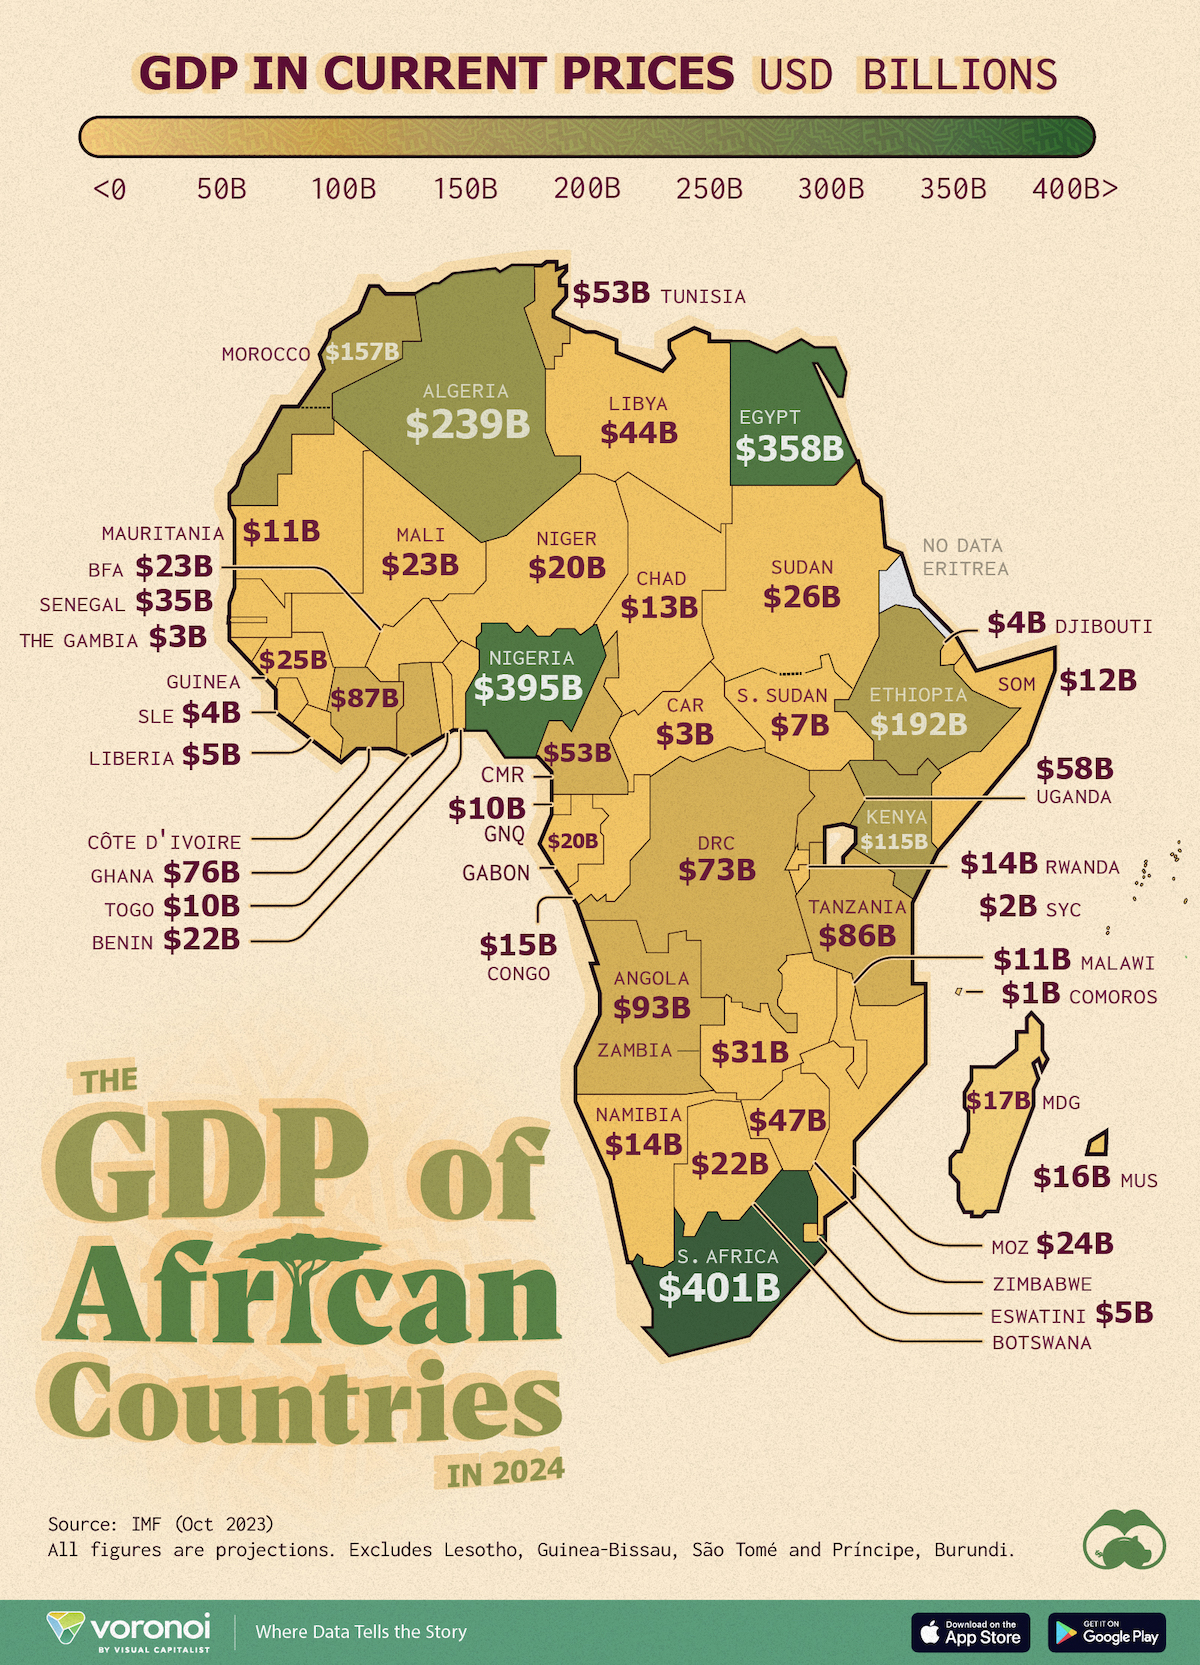
We visualize the 2024 gross domestic product (GDP) projections for African countries from International Monetary Fund (IMF) estimates, last updated in October 2023. The data is in current USD, and does not include projections for Eritrea.
Furthermore, data for Lesotho, Guinea-Bissau, São Tomé and Príncipe, and Burundi has been left off the map due to a lack of space but has been included in the article’s table.
Ranked: Africa’s Economies by GDP
At first place, South Africa is Africa’s biggest economy in nominal terms, with an estimated GDP of nearly $400 billion.
The country’s mining industry is a major contributor to the economy, accounting for nearly 60% of total exports in the first half of 2023. South Africa is one of the world’s biggest producers of gold, diamonds, platinum, manganese, and other minerals.
However, concerns regarding the sustainability of South Africa’s mining industry have grown since the pandemic. According to a report by PwC, the country’s gold industry may have less than 30 years left without renewed investment.
| Rank | Country | GDP |
|---|---|---|
| 1 | 🇿🇦 South Africa | $401B |
| 2 | 🇳🇬 Nigeria | $395B |
| 3 | 🇪🇬 Egypt | $358B |
| 4 | 🇩🇿 Algeria | $239B |
| 5 | 🇪🇹 Ethiopia | $192B |
| 6 | 🇲🇦 Morocco | $157B |
| 7 | 🇰🇪 Kenya | $115B |
| 8 | 🇦🇴 Angola | $93B |
| 9 | 🇨🇮 Côte d'Ivoire | $87B |
| 10 | 🇹🇿 Tanzania | $86B |
| 11 | 🇬🇭 Ghana | $76B |
| 12 | 🇨🇩 DRC | $73B |
| 13 | 🇺🇬 Uganda | $58B |
| 14 | 🇹🇳 Tunisia | $53B |
| 15 | 🇨🇲 Cameroon | $53B |
| 16 | 🇿🇼 Zimbabwe | $47B |
| 17 | 🇱🇾 Libya | $44B |
| 18 | 🇸🇳 Senegal | $35B |
| 19 | 🇿🇲 Zambia | $31B |
| 20 | 🇸🇩 Sudan | $26B |
| 21 | 🇬🇳 Guinea | $25B |
| 22 | 🇲🇿 Mozambique | $24B |
| 23 | 🇲🇱 Mali | $23B |
| 24 | 🇧🇫 Burkina Faso | $23B |
| 25 | 🇧🇼 Botswana | $22B |
| 26 | 🇧🇯 Benin | $22B |
| 27 | 🇬🇦 Gabon | $20B |
| 28 | 🇳🇪 Niger | $20B |
| 29 | 🇲🇬 Madagascar | $17B |
| 30 | 🇲🇺 Mauritius | $16B |
| 31 | 🇨🇬 Congo | $15B |
| 32 | 🇷🇼 Rwanda | $14B |
| 33 | 🇳🇦 Namibia | $14B |
| 34 | 🇹🇩 Chad | $13B |
| 35 | 🇸🇴 Somalia | $12B |
| 36 | 🇲🇼 Malawi | $11B |
| 37 | 🇲🇷 Mauritania | $11B |
| 38 | 🇬🇶 Equatorial Guinea | $10B |
| 39 | 🇹🇬 Togo | $10B |
| 40 | 🇸🇸 South Sudan | $7B |
| 41 | 🇸🇿 Eswatini | $5B |
| 42 | 🇱🇷 Liberia | $5B |
| 43 | 🇩🇯 Djibouti | $4B |
| 44 | 🇸🇱 Sierra Leone | $4B |
| 45 | 🇧🇮 Burundi | $3B |
| 46 | 🇨🇫 Central African Republic | $3B |
| 47 | 🇨🇻 Cabo Verde | $3B |
| 48 | 🇬🇲 Gambia, The | $3B |
| 49 | 🇱🇸 Lesotho | $3B |
| 50 | 🇬🇼 Guinea-Bissau | $2B |
| 51 | 🇸🇨 Seychelles | $2B |
| 52 | 🇰🇲 Comoros | $1B |
| 53 | 🇸🇹 São Tomé and Príncipe | $1B |
| Total | $2,987B |
Note: Figures are rounded.
Close behind South Africa, Nigeria’s economic output in 2024 is estimated at $395 billion. Declining oil production—the country’s main export—along with foreign exchange woes, have made for a broader economic crisis, sparking protests. Inflation is also running rampant in the economy as well: expected to peak at 33% by mid-2024.
Africa’s third-largest economy, Egypt, is also suffering from extremely high inflation since the beginning of the Russia-Ukraine conflict. This is largely due to the country’s reliance on food imports from those nations. According to the IMF, core inflation in Egypt hit nearly 40% in 2023, while food inflation briefly surpassed 70%.
Oil plays a huge role in fourth-ranked Algeria as well, contributing nearly 25% to the country’s $239 billion economic output.
However, in fifth-ranked Ethiopia, agriculture accounts for more than 40% of the country’s $192 billion GDP and coffee is its biggest export. Gold and gemstone mining are seen as an important areas of diversification for the country’s economy.

-

 Mining1 week ago
Gold vs. S&P 500: Which Has Grown More Over Five Years?
-

 Markets2 weeks ago
Ranked: The Most Valuable Housing Markets in America
-

 Money2 weeks ago
Which States Have the Highest Minimum Wage in America?
-

 AI2 weeks ago
Ranked: Semiconductor Companies by Industry Revenue Share
-

 Markets2 weeks ago
Ranked: The World’s Top Flight Routes, by Revenue
-

 Countries2 weeks ago
Population Projections: The World’s 6 Largest Countries in 2075
-

 Markets2 weeks ago
The Top 10 States by Real GDP Growth in 2023
-

 Demographics2 weeks ago
The Smallest Gender Wage Gaps in OECD Countries