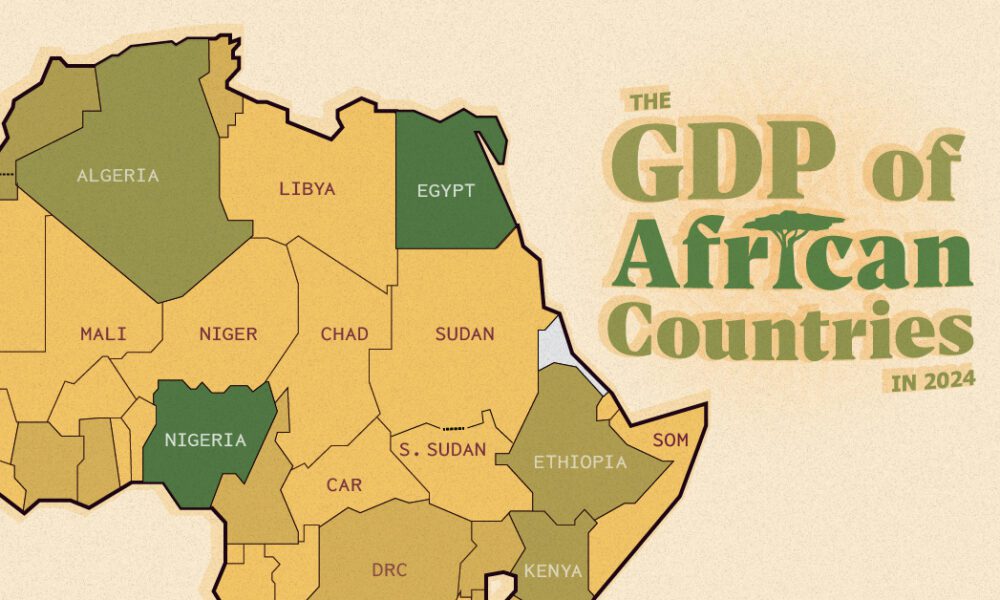
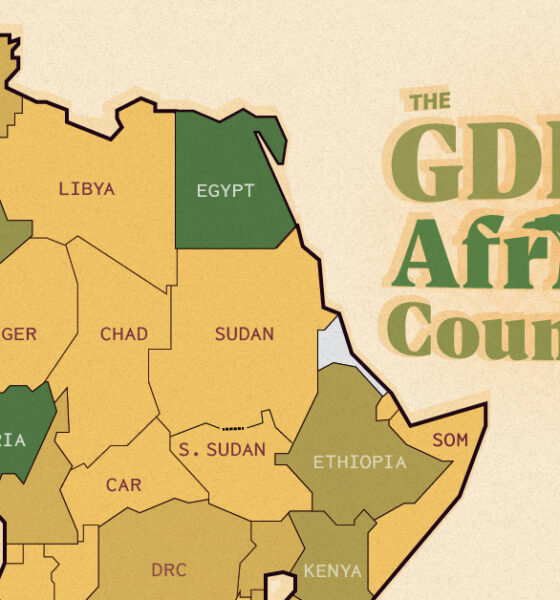
The top three economic powerhouses of Africa contribute more than one-third to the African economy. We rank the nations of...


We map out Africa’s population density, spotlighting the continent’s most populous countries and cities.
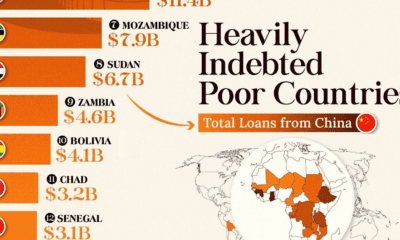

This infographic lists countries in Africa and other developing regions that received billions in loans from China.
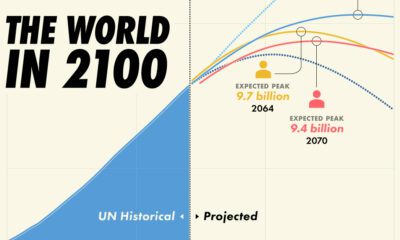

Population projections from the UN suggest that there will be over 10 billion people by 2060, though other organizations disagree.
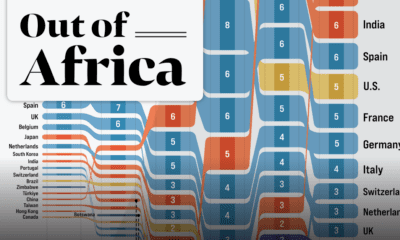

In 2020 the African continent exported nearly $378 billion worth of goods. Here are the top destinations for 25 years of Africa’s exports.
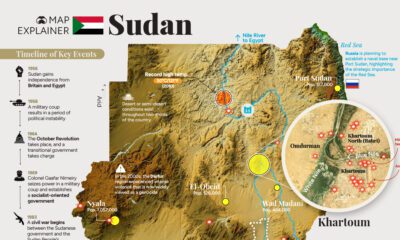

This comprehensive map explainer covers both key facts about Sudan, as well as information on the violent power struggle unfolding there
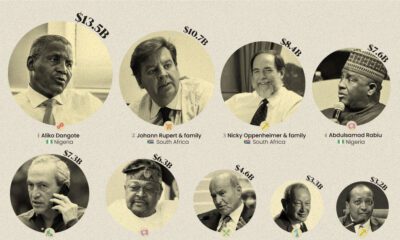

This infographic ranks the wealthiest 15 billionaires on the African continent.
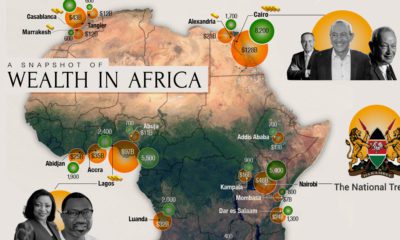

Total private wealth in Africa is now estimated to be US$2.1 trillion. This map looks at where all that wealth is concentrated around the continent.
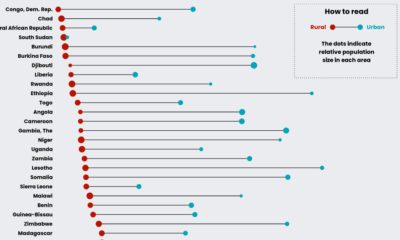

This graphic compares water accessibility in countries across Sub-Saharan Africa, showing the gap between its rural and urban populations.
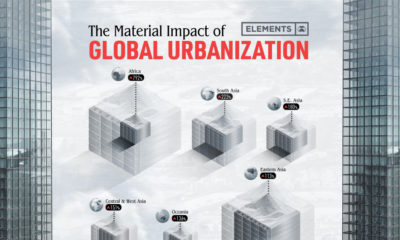

The world’s material consumption is expected to grow from 41 billion tonnes in 2010 to about 89 billion tonnes by 2050. This graphic shows the impact...


 Creator Program