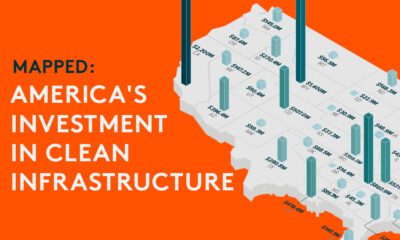

This graphic shows high levels of investment in U.S. clean infrastructure between 2021 and 2023.
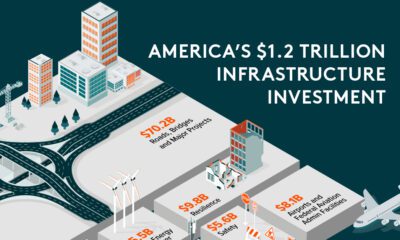

Graphic showing U.S. infrastructure investment highlighting that investment is primarily going to roads, bridges, and other major projects.
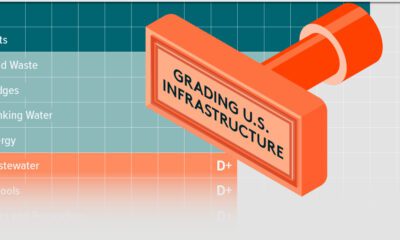

This graphic shows U.S infrastructure grades and highlights the general low grade.
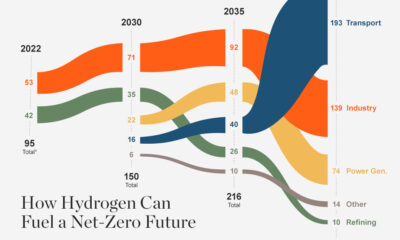

In the race to net zero, demand for hydrogen could increase to 430 Mt p.a. by 2050, but will supply be there when the world needs...


This chart highlights the different countries, and the number of people, facing water security issues around the world.

How can investors prepare for a market downturn? What goes into a recession investment strategy? We look at three sectors to consider.
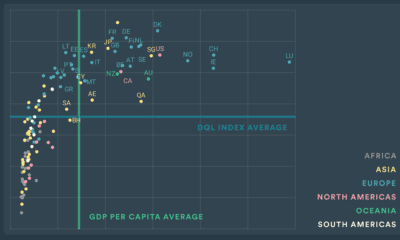

Which countries have the best internet quality, or electronic security? This index breaks down the digital quality of life of countries in 2022.
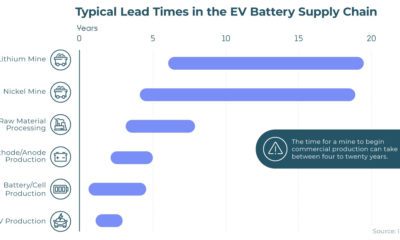

According to new research from KGP Auto, 2040 electric vehicle targets are unlikely to be met. This graphic explains why.
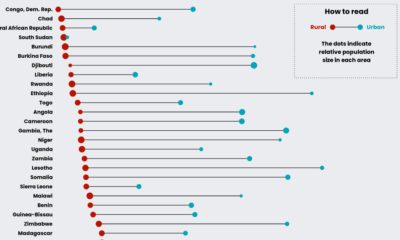

This graphic compares water accessibility in countries across Sub-Saharan Africa, showing the gap between its rural and urban populations.
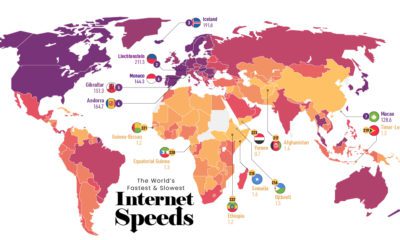

Internet speeds vary depending on your location. Here’s a look at the countries with the fastest—and slowest—internet speeds worldwide.


 Creator Program