Mining
Ranked: The World’s Top Diamond Mining Countries, by Carats and Value
Article/Editing:
Ranked: World Diamond Mining By Country, Carat, and Value
Only 22 countries in the world engage in rough diamond production—also known as uncut, raw or natural diamonds—mining for them from deposits within their territories.
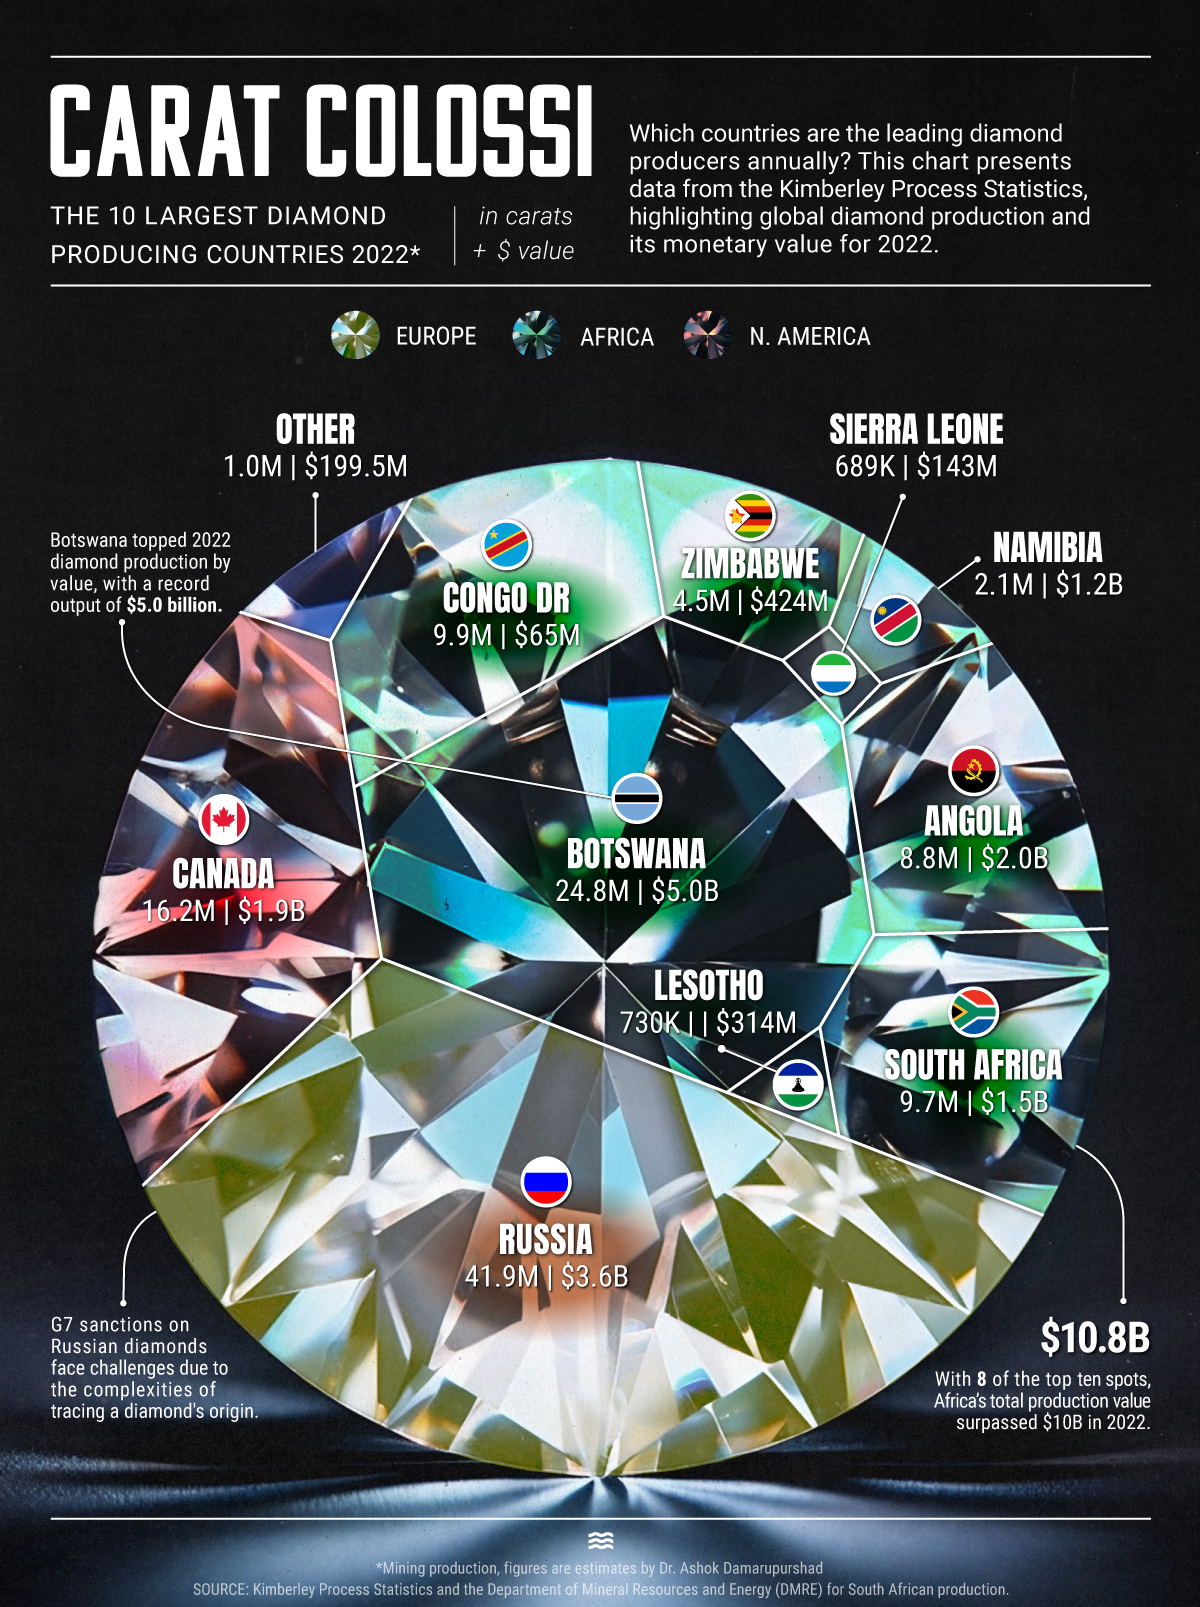
This chart, by Sam Parker illustrates the leaders in rough diamond production by weight and value. It uses data from Kimberly Process (an international certification organization) along with estimates by Dr. Ashok Damarupurshad, a precious metals and diamond specialist in South Africa.
Rough Diamond Production, By Weight
Russia takes the top spot as the world’s largest rough diamond producer, mining close to 42 million carats in 2022, well ahead of its peers.
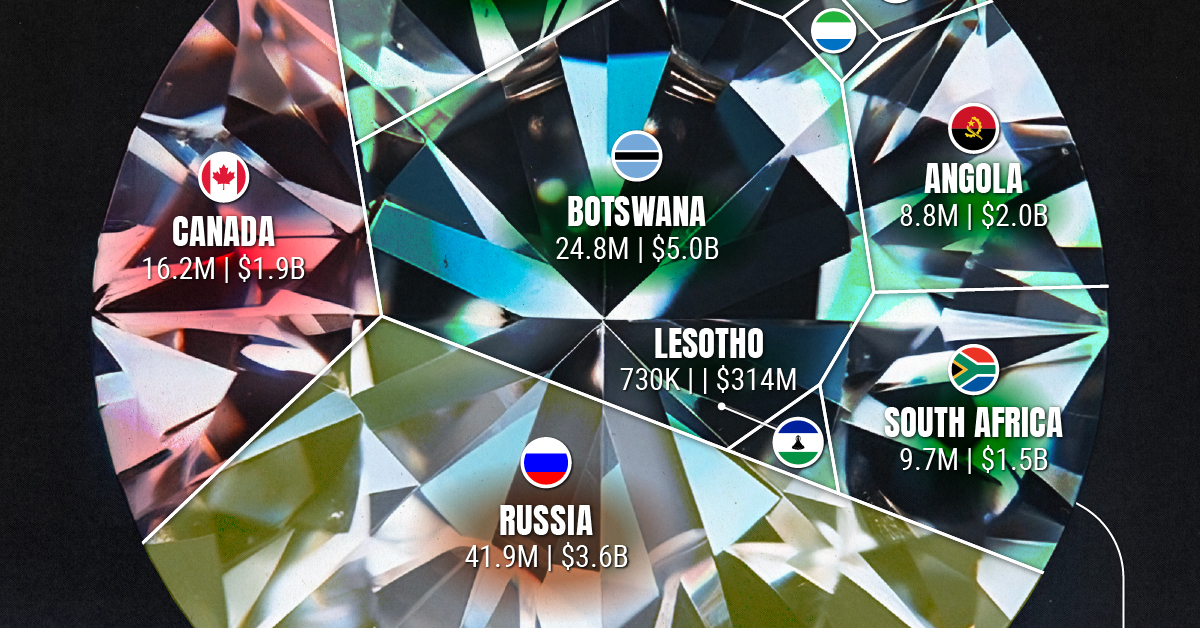
Russia’s large lead over second-place Botswana (24.8 million carats) and third-ranked Canada (16.2 million carats) indicates that the country’s diamond production is circumventing sanctions due to the difficulties in tracing a diamond’s origin.
Here’s a quick breakdown of rough diamond production in the world.
| Rank | Country | Rough Diamond Production (Carats) |
|---|---|---|
| 1 | 🇷🇺 Russia | 41,923,910 |
| 2 | 🇧🇼 Botswana | 24,752,967 |
| 3 | 🇨🇦 Canada | 16,249,218 |
| 4 | 🇨🇩 DRC | 9,908,998 |
| 5 | 🇿🇦 South Africa | 9,660,233 |
| 6 | 🇦🇴 Angola | 8,763,309 |
| 7 | 🇿🇼 Zimbabwe | 4,461,450 |
| 8 | 🇳🇦 Namibia | 2,054,227 |
| 9 | 🇱🇸 Lesotho | 727,737 |
| 10 | 🇸🇱 Sierra Leone | 688,970 |
| 11 | 🇹🇿 Tanzania | 375,533 |
| 12 | 🇧🇷 Brazil | 158,420 |
| 13 | 🇬🇳 Guinea | 128,771 |
| 14 | 🇨🇫 Central African Republic | 118,044 |
| 15 | 🇬🇾 Guyana | 83,382 |
| 16 | 🇬🇭 Ghana | 82,500 |
| 17 | 🇱🇷 Liberia | 52,165 |
| 18 | 🇨🇮 Cote D'Ivoire | 3,904 |
| 19 | 🇨🇬 Republic of Congo | 3,534 |
| 20 | 🇨🇲 Cameroon | 2,431 |
| 21 | 🇻🇪 Venezuela | 1,665 |
| 22 | 🇲🇱 Mali | 92 |
| Total | 120,201,460 |
Note: South Africa’s figures are estimated.
As with most other resources, (oil, gold, uranium), rough diamond production is distributed unequally. The top 10 rough diamond producing countries by weight account for 99.2% of all rough diamonds mined in 2022.
Diamond Mining, by Country
However, higher carat mined doesn’t necessarily mean better value for the diamond. Other factors like the cut, color, and clarity also influence a diamond’s value.
Here’s a quick breakdown of diamond production by value (USD) in 2022.
| Rank | Country | Rough Diamond Value (USD) |
|---|---|---|
| 1 | 🇧🇼 Botswana | $4,975M |
| 2 | 🇷🇺 Russia | $3,553M |
| 3 | 🇦🇴 Angola | $1,965M |
| 4 | 🇨🇦 Canada | $1,877M |
| 5 | 🇿🇦 South Africa | $1,538M |
| 6 | 🇳🇦 Namibia | $1,234M |
| 7 | 🇿🇼 Zimbabwe | $424M |
| 8 | 🇱🇸 Lesotho | $314M |
| 9 | 🇸🇱 Sierra Leone | $143M |
| 10 | 🇹🇿 Tanzania | $110M |
| 11 | 🇨🇩 DRC | $65M |
| 12 | 🇧🇷 Brazil | $30M |
| 13 | 🇱🇷 Liberia | $18M |
| 14 | 🇨🇫 Central African Republic | $15M |
| 15 | 🇬🇾 Guyana | $14M |
| 16 | 🇬🇳 Guinea | $6M |
| 17 | 🇬🇭 Ghana | $3M |
| 18 | 🇨🇲 Cameroon | $0.25M |
| 19 | 🇨🇬 Republic of Congo | $0.20M |
| 20 | 🇨🇮 Cote D'Ivoire | $0.16M |
| 21 | 🇻🇪 Venezuela | $0.10M |
| 22 | 🇲🇱 Mali | $0.06M |
| Total | $16,290M |
Note: South Africa’s figures are estimated. Furthermore, numbers have been rounded and may not sum to the total.
Thus, even though Botswana only produced 59% of Russia’s diamond weight in 2022, it had a trade value of nearly $5 billion, approximately 1.5 times higher than Russia’s for the same year.
Another example is Angola, which is ranked 6th in diamond production, but 3rd in diamond value.
Both countries (as well as South Africa, Canada, and Namibia) produce gem-quality rough diamonds versus countries like Russia and the DRC whose diamonds are produced mainly for industrial use.
Which Regions Produce the Most Diamonds in 2022?
Unsurprisingly, Africa is the largest rough diamond producing region, accounting for 51% of output by weight, and 66% by value.
| Rank | Region | Share of Rough Diamond Production (%) | Share of Rough Diamond Value (%) |
|---|---|---|---|
| 1 | Africa | 51.4% | 66.4% |
| 2 | Europe | 34.9% | 32.9% |
| 3 | North America | 13.5% | 52.8% |
| 4 | South America | 0.2% | 2.4% |
However diamond mining in Africa is a relatively recent phenomenon, fewer than 200 years old. Diamonds had been discovered—and prized—as far back as 2,000 years ago in India, later on spreading west to Egyptian pharaohs and the Roman Empire.
By the start of the 20th century, diamond production on a large scale took off: first in South Africa, and decades later in other African countries. In fact between 1889–1959, Africa produced 98% of the world’s diamonds.
And in the latter half of the 20th century, the term blood diamond evolved from diamonds mined in African conflict zones used to finance insurgency or crime.

This article was published as a part of Visual Capitalist's Creator Program, which features data-driven visuals from some of our favorite Creators around the world.


Lithium
Ranked: The Top 10 EV Battery Manufacturers in 2023
Asia dominates this ranking of the world’s largest EV battery manufacturers in 2023.


The Top 10 EV Battery Manufacturers in 2023
This was originally posted on our Voronoi app. Download the app for free on iOS or Android and discover incredible data-driven charts from a variety of trusted sources.
Despite efforts from the U.S. and EU to secure local domestic supply, all major EV battery manufacturers remain based in Asia.
In this graphic we rank the top 10 EV battery manufacturers by total battery deployment (measured in megawatt-hours) in 2023. The data is from EV Volumes.
Chinese Dominance
Contemporary Amperex Technology Co. Limited (CATL) has swiftly risen in less than a decade to claim the title of the largest global battery group.
The Chinese company now has a 34% share of the market and supplies batteries to a range of made-in-China vehicles, including the Tesla Model Y, SAIC’s MG4/Mulan, and various Li Auto models.
| Company | Country | 2023 Production (megawatt-hour) | Share of Total Production |
|---|---|---|---|
| CATL | 🇨🇳 China | 242,700 | 34% |
| BYD | 🇨🇳 China | 115,917 | 16% |
| LG Energy Solution | 🇰🇷 Korea | 108,487 | 15% |
| Panasonic | 🇯🇵 Japan | 56,560 | 8% |
| SK On | 🇰🇷 Korea | 40,711 | 6% |
| Samsung SDI | 🇰🇷 Korea | 35,703 | 5% |
| CALB | 🇨🇳 China | 23,493 | 3% |
| Farasis Energy | 🇨🇳 China | 16,527 | 2% |
| Envision AESC | 🇨🇳 China | 8,342 | 1% |
| Sunwoda | 🇨🇳 China | 6,979 | 1% |
| Other | - | 56,040 | 8% |
In 2023, BYD surpassed LG Energy Solution to claim second place. This was driven by demand from its own models and growth in third-party deals, including providing batteries for the made-in-Germany Tesla Model Y, Toyota bZ3, Changan UNI-V, Venucia V-Online, as well as several Haval and FAW models.
The top three battery makers (CATL, BYD, LG) collectively account for two-thirds (66%) of total battery deployment.
Once a leader in the EV battery business, Panasonic now holds the fourth position with an 8% market share, down from 9% last year. With its main client, Tesla, now sourcing batteries from multiple suppliers, the Japanese battery maker seems to be losing its competitive edge in the industry.
Overall, the global EV battery market size is projected to grow from $49 billion in 2022 to $98 billion by 2029, according to Fortune Business Insights.

-

 Debt1 week ago
How Debt-to-GDP Ratios Have Changed Since 2000
-

 Countries2 weeks ago
Population Projections: The World’s 6 Largest Countries in 2075
-

 Markets2 weeks ago
The Top 10 States by Real GDP Growth in 2023
-

 Demographics2 weeks ago
The Smallest Gender Wage Gaps in OECD Countries
-

 United States2 weeks ago
Where U.S. Inflation Hit the Hardest in March 2024
-

 Green2 weeks ago
Top Countries By Forest Growth Since 2001
-

 United States2 weeks ago
Ranked: The Largest U.S. Corporations by Number of Employees
-

 Maps2 weeks ago
The Largest Earthquakes in the New York Area (1970-2024)