Africa
Charted: Top Destinations for Africa’s Exports (1995-2020)
Article/Editing:
![]() Winner of the 2023 Creator Program Challenge.
Winner of the 2023 Creator Program Challenge.
Click to view this graphic in a higher-resolution
Charted: Top Destinations for Africa’s Exports (1995-2020)
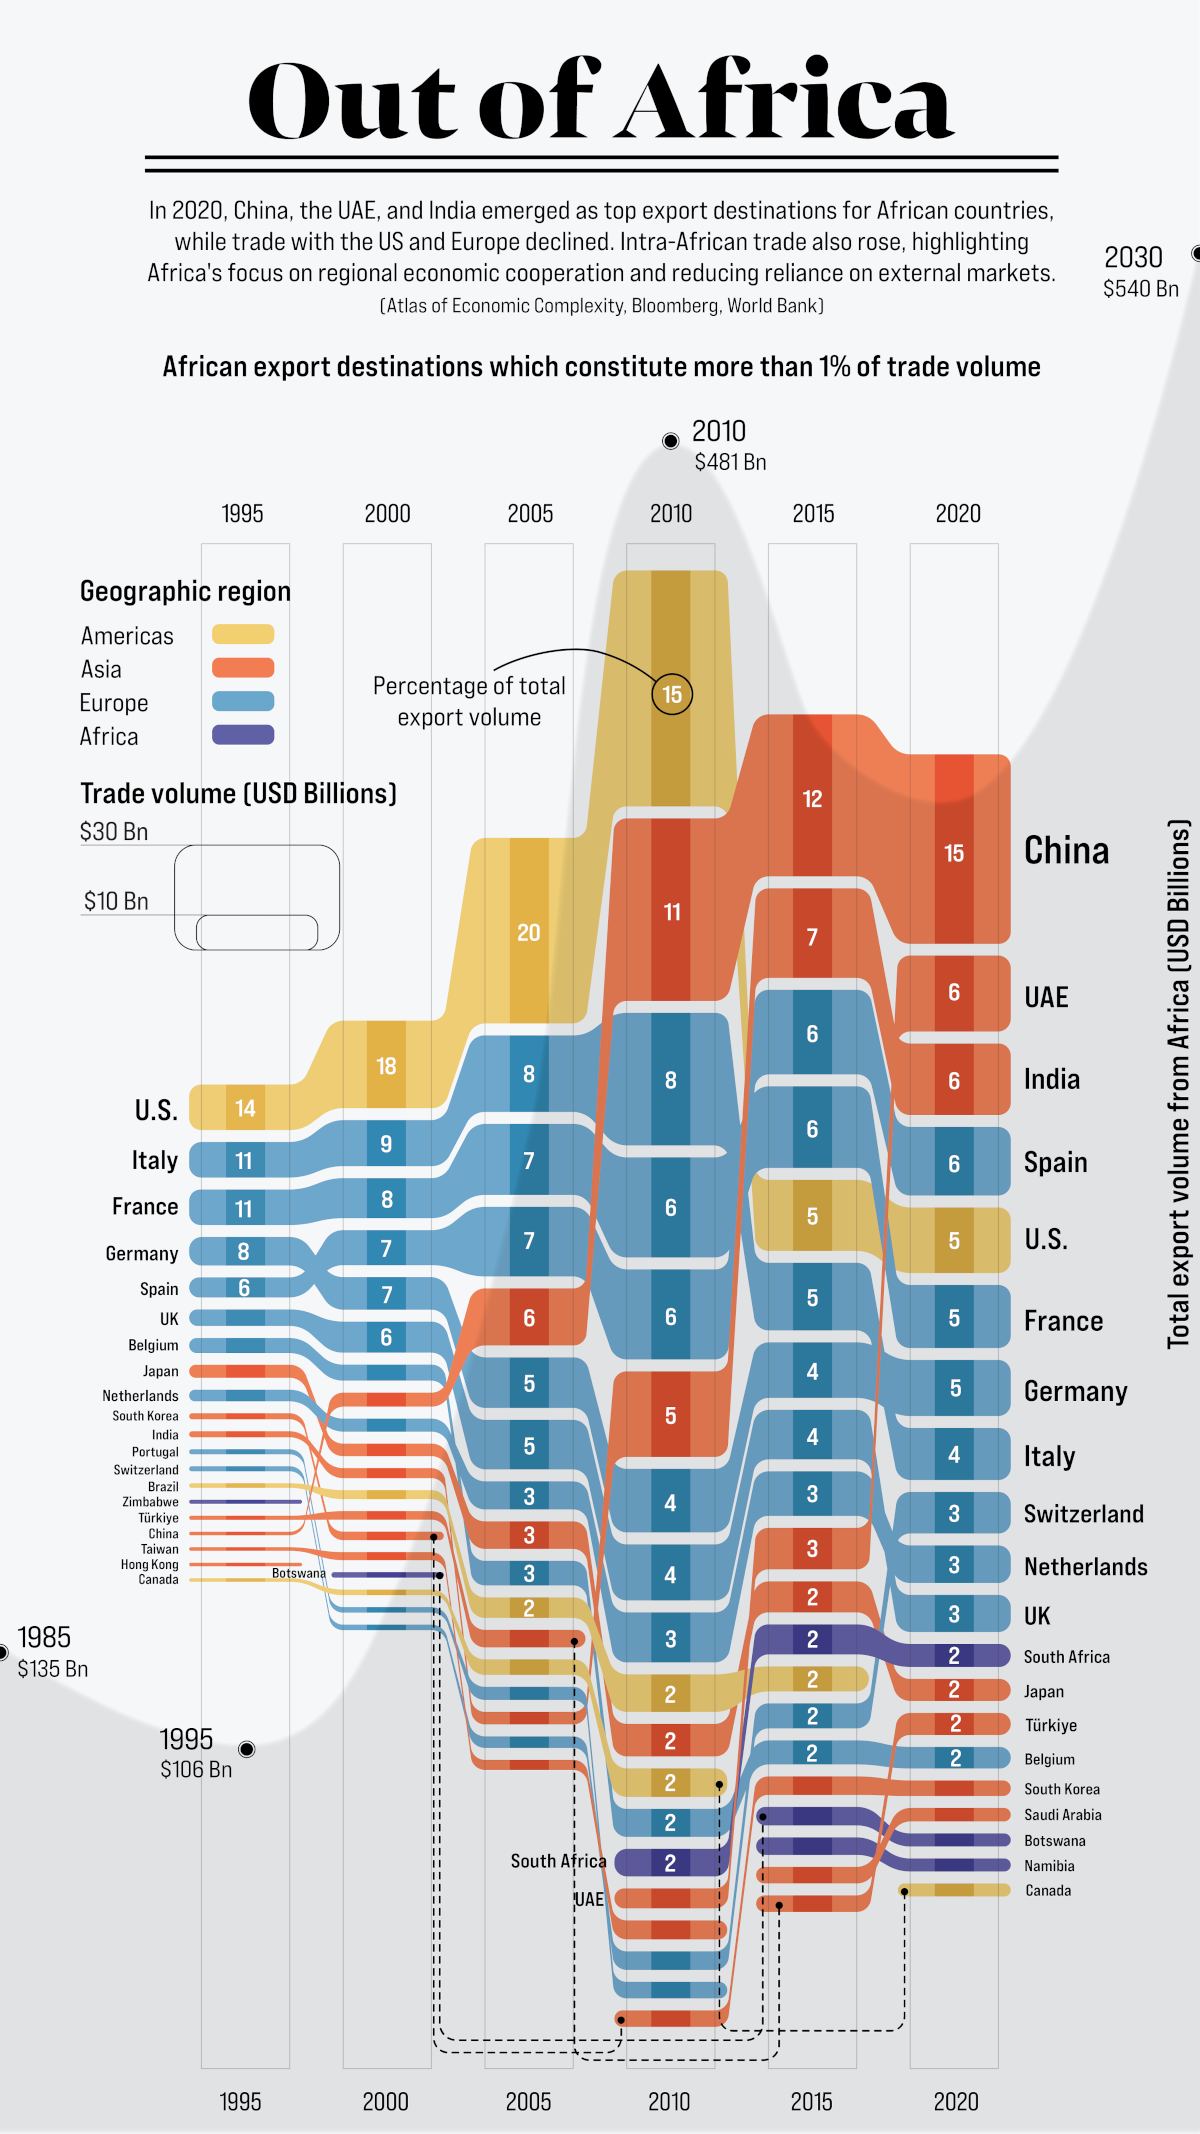
Just under 30 years ago, exports originating from countries in Africa sat at $106 billion annually, primarily going to nations in the West. By 2020, Africa’s exports had more than tripled, but now with Asia as the primary destination.
The world’s second-largest continent, much of the value of Africa’s exports are concentrated in natural resources like petroleum, gold, diamonds, natural gas, and coal. Agricultural commodities like tea, coffee, and cotton also find large markets overseas.
Which countries are the top destinations for Africa’s exports?
This graphic from Sebastian Gräff uses data from Harvard University’s Atlas of Economic Complexity, the World Bank, and Bloomberg to track total exports from African countries over the years. Countries receiving a 1% or greater share of total exports have been included, and percentages have been rounded.
Tracking Africa’s Exports Between 1995 and 2005
The U.S. was the top destination for African goods for many years, led by the country’s demand for petroleum products. At its peak in 2005, the U.S. received one-fifth of the continent’s exports, valued at $55 billion.
Here’s a look at all the countries that had a 1% or greater share of Africa’s total export value at some point from 1995 to 2005.
| Country | Region | 1995 | 2000 | 2005 |
|---|---|---|---|---|
| 🇺🇸 U.S. | North America | 14% | 18% | 20% |
| 🇮🇹 Italy | Europe | 11% | 9% | 8% |
| 🇫🇷 France | Europe | 11% | 8% | 7% |
| 🇩🇪 Germany | Europe | 8% | 7% | 5% |
| 🇪🇸 Spain | Europe | 6% | 7% | 7% |
| 🇬🇧 UK | Europe | 5% | 6% | 5% |
| 🇧🇪 Belgium | Europe | 5% | 3% | 3% |
| 🇯🇵 Japan | Asia | 4% | 3% | 3% |
| 🇳🇱 Netherlands | Europe | 3% | 3% | 3% |
| 🇰🇷 South Korea | Asia | 2% | 2% | 1% |
| 🇮🇳 India | Asia | 2% | 2% | 1% |
| 🇵🇹 Portugal | Europe | 2% | 1% | 1% |
| 🇨🇳 China | Asia | 1% | 3% | 6% |
| 🇧🇷 Brazil | South America | 1% | 2% | 2% |
| 🇹🇷 Turkiye | Asia | 1% | 2% | 2% |
| 🇨🇦 Canada | North America | 1% | 1% | 2% |
| 🇨🇭 Switzerland | Europe | 1% | 1% | 1% |
| 🇿🇼 Zimbabwe | Africa | 1% | 1% | 1% |
| 🇹🇼 Taiwan | Asia | 1% | 2% | 1% |
| 🇸🇦 Saudi Arabia | Asia | 1% | 1% | 1% |
| 🇿🇦 South Africa | Africa | 1% | 0% | 1% |
| 🇨🇮 Côte d'Ivoire | Africa | 1% | 1% | 1% |
| 🇭🇰 Hong Kong | Asia | 1% | 0% | 0% |
| 🇦🇹 Austria | Europe | 1% | 0% | 0% |
| 🇬🇷 Greece | Europe | 1% | 1% | 0% |
| 🇹🇭 Thailand | Asia | 1% | 0% | 0% |
| 🇸🇬 Singapore | Asia | 1% | 0% | 0% |
| 🇲🇿 Mozambique | Africa | 1% | 1% | 0% |
| 🇹🇳 Tunisia | Africa | 1% | 0% | 0% |
| 🇮🇩 Indonesia | Asia | 1% | 1% | 0% |
| 🇳🇬 Nigeria | Africa | 0% | 0% | 1% |
| 🇦🇺 Australia | Oceania | 0% | 0% | 1% |
| 🇧🇼 Botswana | Africa | N/A | 1% | 1% |
| 🇳🇦 Namibia | Africa | N/A | 1% | 1% |
| 🇸🇿 Eswatini | Africa | N/A | 1% | 0% |
| 🇿🇲 Zambia | Africa | N/A | 1% | 0% |
Western European countries—Italy, France, Spain, Germany, Belgium and the UK—also accounted for a significant share of Africa’s exports throughout this time period. Part of this was due to century-old relationships and colonial legacies, but trade was also encouraged by initiatives like the 1976 Lomé Convention, which gave products from developing African countries (particularly former colonies) duty-free access to European markets in exchange for developmental aid.
During the mid-2000s, China also started to take up a growing share of the continent’s exports, as its rapid industrialization led to skyrocketing demand for commodities such as oil, iron ore, and copper—all key African exports.
Asia’s Growing Export Share Between 2010 and 2020
By the year 2010, as African exports topped the $481 billion per year mark, the global market was rapidly starting to change.
For starters, thanks to a considerable increase in domestic oil and natural gas production, the United States began cutting back on African petroleum imports.
At the same time, China had been actively seeking resources and investment opportunities in the developing world as part of its greater geopolitical strategy. By 2015, it had surpassed the U.S. as Africa’s primary export destination, marking a shift in the continent’s trade dynamics.
Here’s a look at all the countries with a 1% or greater share of Africa’s total export value from 2010 to 2020.
| Country | Region | 2010 | 2015 | 2020 |
|---|---|---|---|---|
| 🇺🇸 U.S. | North America | 15% | 5% | 5% |
| 🇨🇳 China | Asia | 11% | 12% | 15% |
| 🇮🇹 Italy | Europe | 8% | 5% | 4% |
| 🇪🇸 Spain | Europe | 6% | 6% | 6% |
| 🇫🇷 France | Europe | 6% | 6% | 5% |
| 🇮🇳 India | Asia | 5% | 7% | 6% |
| 🇩🇪 Germany | Europe | 4% | 4% | 5% |
| 🇬🇧 UK | Europe | 4% | 4% | 3% |
| 🇳🇱 Netherlands | Europe | 3% | 3% | 3% |
| 🇯🇵 Japan | Asia | 2% | 2% | 2% |
| 🇧🇪 Belgium | Europe | 2% | 2% | 2% |
| 🇿🇦 South Africa | Africa | 2% | 2% | 2% |
| 🇧🇷 Brazil | South America | 2% | 2% | 1% |
| 🇨🇦 Canada | North America | 2% | 1% | 1% |
| 🇦🇪 UAE | Asia | 1% | 3% | 6% |
| 🇨🇭 Switzerland | Europe | 1% | 2% | 3% |
| 🇹🇷 Turkiye | Asia | 1% | 1% | 2% |
| 🇵🇹 Portugal | Europe | 1% | 1% | 1% |
| 🇰🇷 South Korea | Asia | 1% | 1% | 1% |
| 🇧🇼 Botswana | Africa | 1% | 1% | 1% |
| 🇳🇦 Namibia | Africa | 1% | 1% | 1% |
| 🇿🇲 Zambia | Africa | 1% | 1% | 1% |
| 🇸🇦 Saudi Arabia | Asia | 1% | 1% | 1% |
| 🇬🇷 Greece | Europe | 1% | 0% | 1% |
| 🇦🇺 Australia | Oceania | 1% | 0% | 1% |
| 🇿🇼 Zimbabwe | Africa | 1% | 1% | 1% |
| 🇲🇾 Malaysia | Asia | 1% | 1% | 1% |
| 🇨🇩 DRC | Africa | 1% | 1% | 1% |
| 🇹🇼 Taiwan | Asia | 1% | 1% | 0% |
| 🇳🇬 Nigeria | Africa | 1% | 1% | 0% |
| 🇨🇮 Côte d'Ivoire | Africa | 1% | 1% | 0% |
| 🇮🇩 Indonesia | Asia | 0% | 1% | 1% |
| 🇲🇿 Mozambique | Africa | 0% | 1% | 1% |
| 🇭🇰 Hong Kong | Asia | 0% | 1% | 1% |
| 🇸🇬 Singapore | Asia | 0% | 0% | 1% |
| 🇹🇭 Thailand | Asia | 0% | 0% | 1% |
| 🇻🇳 Vietnam | Asia | 0% | 0% | 1% |
| 🇷🇺 Russia | Europe | 0% | 0% | 1% |
| 🇵🇰 Pakistan | Asia | 0% | 0% | 1% |
| 🇵🇱 Poland | Europe | 0% | 0% | 1% |
| 🇺🇬 Uganda | Asia | 0% | 0% | 1% |
China was joined in the top three ranks by India and the UAE, who were also experiencing rapid industrialization and growing demand for African commodities. In 2020, nearly 40% of Africa’s exports found a market in Asia, led by China and India’s significant trade volumes.
In comparison, Western Europe had started relinquish both its share and value of African goods imported. Alongside growing demand from developing countries, there became greater diversification in African export markets, with countries from Asia (Malaysia, Pakistan), Eastern Europe (Poland, Russia), and within Africa (the Democratic Republic of the Congo, Uganda), accounting for growing shares of African exports.
The Future of the African Export Market
Though Africa’s largest export markets are outside the continent for now, there is vast untapped potential for inter-regional exports, which stood at only 15% of total export value in 2020.
There is movement to expand on this trade, with the African Continental Free Trade Area (AfCFTA) established in 2018 to reduce trade barriers between African countries. According to UN estimates, it has the potential to create a $3 trillion market within the continent alone.
With one of the fastest-growing regional populations, the African continent’s economic stakes have never been higher. So who will end up dominating Africa’s trade landscape in the decades to come?
 |
WINNER: The 2023 Creator Program Challenge
Winners of our Creator Program Challenges receive their own ambassador badge, prize money, and become a trusted creator on Visual Capitalist. For all results from the 2023 Creator Program Challenge, click here to check out the year’s shortlist winners. |

This article was published as a part of Visual Capitalist's Creator Program, which features data-driven visuals from some of our favorite Creators around the world.


Africa
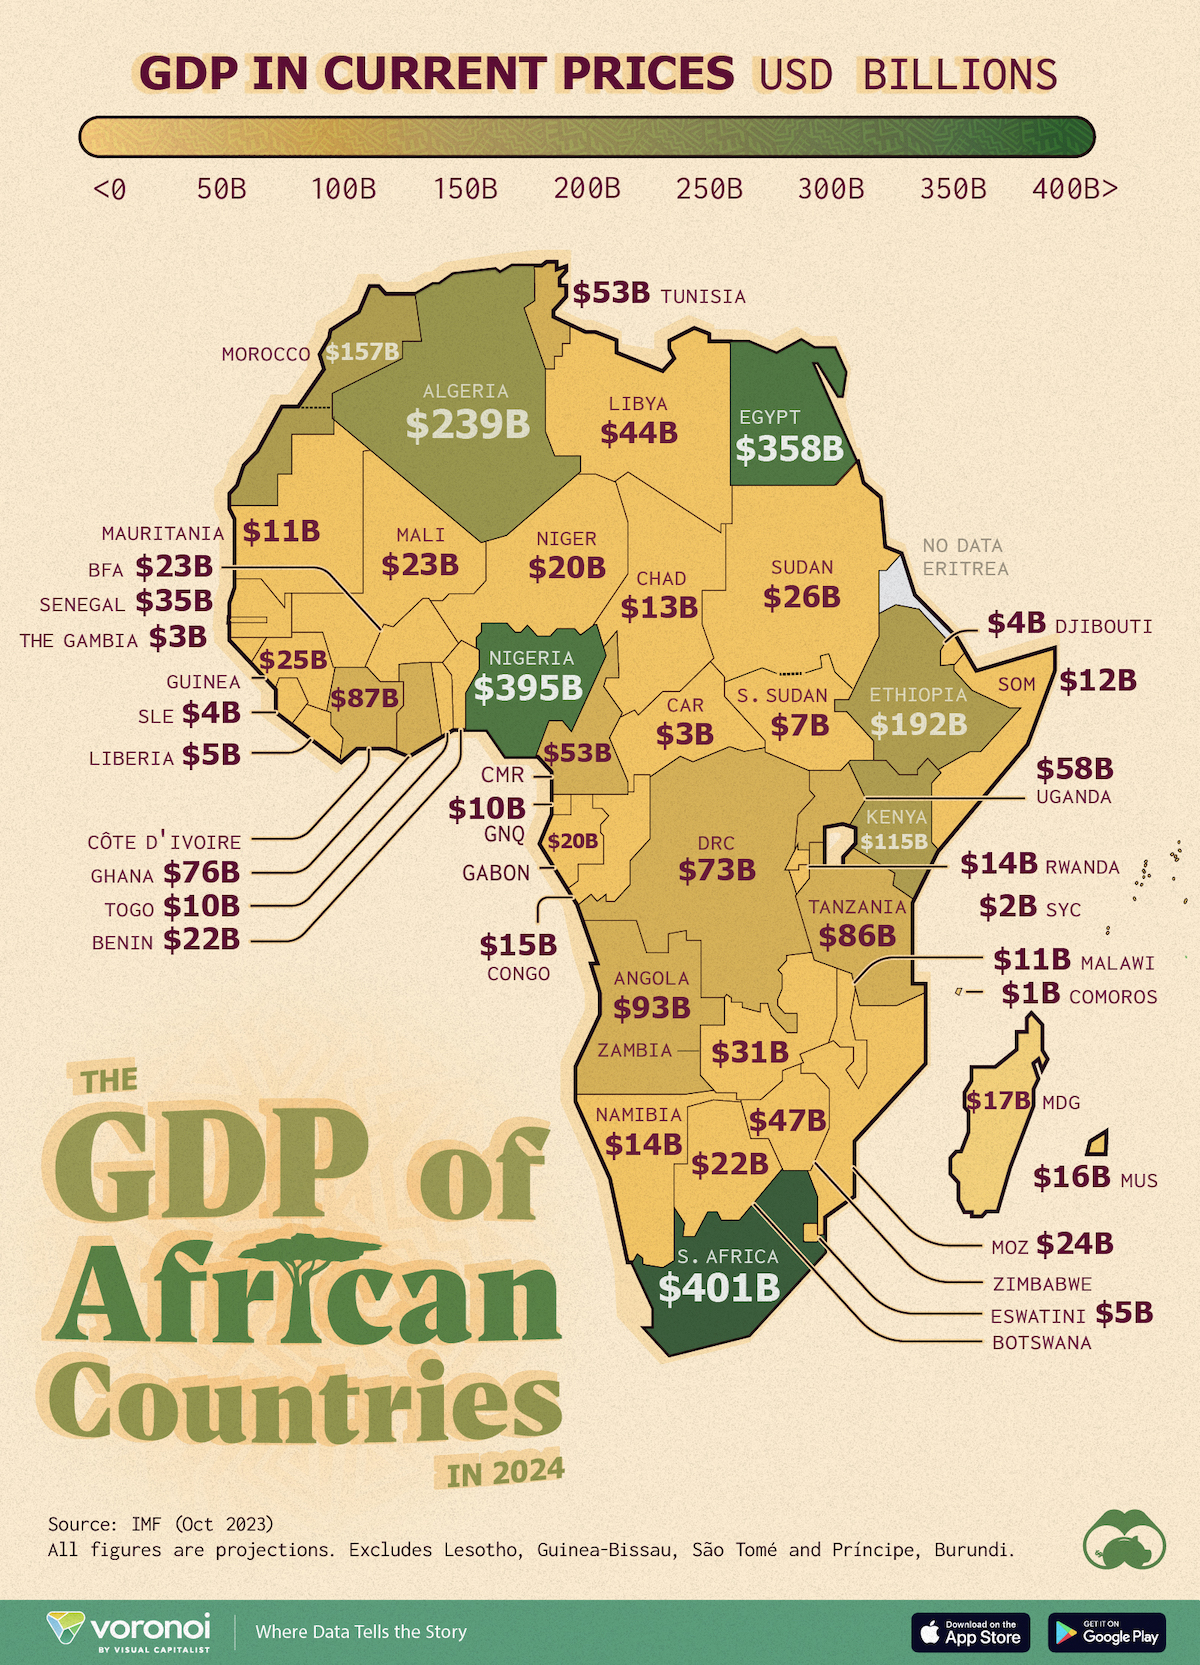
Mapped: Breaking Down the $3 Trillion African Economy by Country
The top three economic powerhouses of Africa contribute more than one-third to the African economy. We rank the nations of the world’s second-largest continent by 2024 GDP estimates.
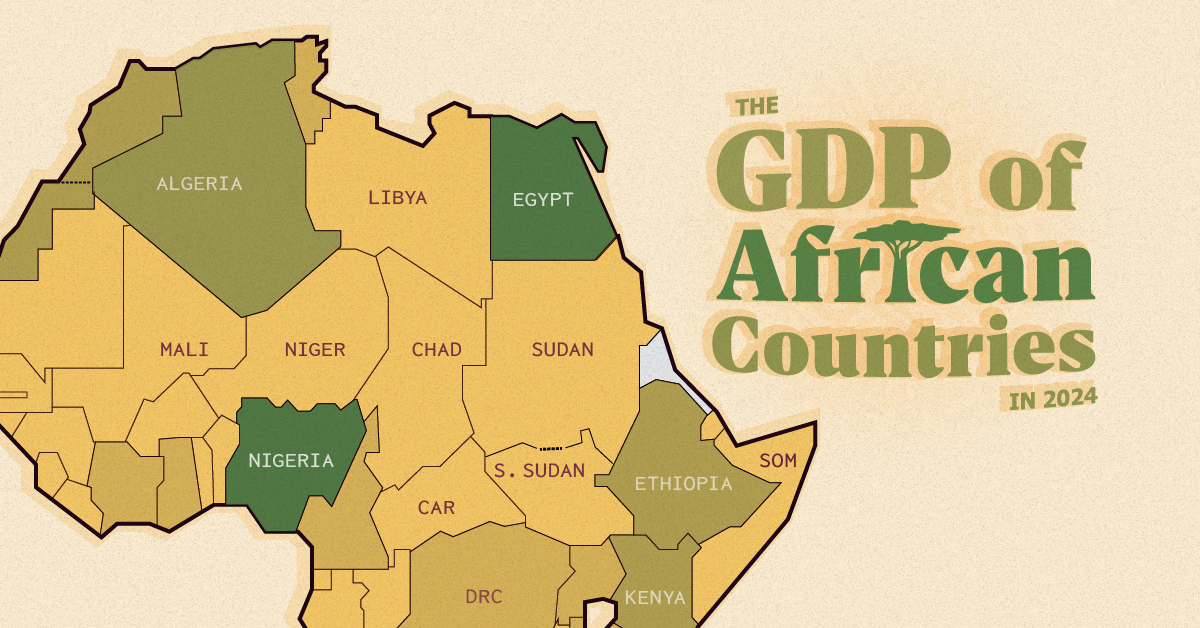
Breaking Down the $3 Trillion African Economy by Country
This was originally posted on our Voronoi app. Download the app for free on iOS or Android and discover incredible data-driven charts from a variety of trusted sources.
Home to 1.4 billion people, the nations of the African continent are widely diverse; not just in culture and language, but also in economic output.
We visualize the 2024 gross domestic product (GDP) projections for African countries from International Monetary Fund (IMF) estimates, last updated in October 2023. The data is in current USD, and does not include projections for Eritrea.
Furthermore, data for Lesotho, Guinea-Bissau, São Tomé and Príncipe, and Burundi has been left off the map due to a lack of space but has been included in the article’s table.
Ranked: Africa’s Economies by GDP
At first place, South Africa is Africa’s biggest economy in nominal terms, with an estimated GDP of nearly $400 billion.
The country’s mining industry is a major contributor to the economy, accounting for nearly 60% of total exports in the first half of 2023. South Africa is one of the world’s biggest producers of gold, diamonds, platinum, manganese, and other minerals.
However, concerns regarding the sustainability of South Africa’s mining industry have grown since the pandemic. According to a report by PwC, the country’s gold industry may have less than 30 years left without renewed investment.
| Rank | Country | GDP |
|---|---|---|
| 1 | 🇿🇦 South Africa | $401B |
| 2 | 🇳🇬 Nigeria | $395B |
| 3 | 🇪🇬 Egypt | $358B |
| 4 | 🇩🇿 Algeria | $239B |
| 5 | 🇪🇹 Ethiopia | $192B |
| 6 | 🇲🇦 Morocco | $157B |
| 7 | 🇰🇪 Kenya | $115B |
| 8 | 🇦🇴 Angola | $93B |
| 9 | 🇨🇮 Côte d'Ivoire | $87B |
| 10 | 🇹🇿 Tanzania | $86B |
| 11 | 🇬🇭 Ghana | $76B |
| 12 | 🇨🇩 DRC | $73B |
| 13 | 🇺🇬 Uganda | $58B |
| 14 | 🇹🇳 Tunisia | $53B |
| 15 | 🇨🇲 Cameroon | $53B |
| 16 | 🇿🇼 Zimbabwe | $47B |
| 17 | 🇱🇾 Libya | $44B |
| 18 | 🇸🇳 Senegal | $35B |
| 19 | 🇿🇲 Zambia | $31B |
| 20 | 🇸🇩 Sudan | $26B |
| 21 | 🇬🇳 Guinea | $25B |
| 22 | 🇲🇿 Mozambique | $24B |
| 23 | 🇲🇱 Mali | $23B |
| 24 | 🇧🇫 Burkina Faso | $23B |
| 25 | 🇧🇼 Botswana | $22B |
| 26 | 🇧🇯 Benin | $22B |
| 27 | 🇬🇦 Gabon | $20B |
| 28 | 🇳🇪 Niger | $20B |
| 29 | 🇲🇬 Madagascar | $17B |
| 30 | 🇲🇺 Mauritius | $16B |
| 31 | 🇨🇬 Congo | $15B |
| 32 | 🇷🇼 Rwanda | $14B |
| 33 | 🇳🇦 Namibia | $14B |
| 34 | 🇹🇩 Chad | $13B |
| 35 | 🇸🇴 Somalia | $12B |
| 36 | 🇲🇼 Malawi | $11B |
| 37 | 🇲🇷 Mauritania | $11B |
| 38 | 🇬🇶 Equatorial Guinea | $10B |
| 39 | 🇹🇬 Togo | $10B |
| 40 | 🇸🇸 South Sudan | $7B |
| 41 | 🇸🇿 Eswatini | $5B |
| 42 | 🇱🇷 Liberia | $5B |
| 43 | 🇩🇯 Djibouti | $4B |
| 44 | 🇸🇱 Sierra Leone | $4B |
| 45 | 🇧🇮 Burundi | $3B |
| 46 | 🇨🇫 Central African Republic | $3B |
| 47 | 🇨🇻 Cabo Verde | $3B |
| 48 | 🇬🇲 Gambia, The | $3B |
| 49 | 🇱🇸 Lesotho | $3B |
| 50 | 🇬🇼 Guinea-Bissau | $2B |
| 51 | 🇸🇨 Seychelles | $2B |
| 52 | 🇰🇲 Comoros | $1B |
| 53 | 🇸🇹 São Tomé and Príncipe | $1B |
| Total | $2,987B |
Note: Figures are rounded.
Close behind South Africa, Nigeria’s economic output in 2024 is estimated at $395 billion. Declining oil production—the country’s main export—along with foreign exchange woes, have made for a broader economic crisis, sparking protests. Inflation is also running rampant in the economy as well: expected to peak at 33% by mid-2024.
Africa’s third-largest economy, Egypt, is also suffering from extremely high inflation since the beginning of the Russia-Ukraine conflict. This is largely due to the country’s reliance on food imports from those nations. According to the IMF, core inflation in Egypt hit nearly 40% in 2023, while food inflation briefly surpassed 70%.
Oil plays a huge role in fourth-ranked Algeria as well, contributing nearly 25% to the country’s $239 billion economic output.
However, in fifth-ranked Ethiopia, agriculture accounts for more than 40% of the country’s $192 billion GDP and coffee is its biggest export. Gold and gemstone mining are seen as an important areas of diversification for the country’s economy.

-

 Markets6 days ago
Visualized: Interest Rate Forecasts for Advanced Economies
-

 Markets2 weeks ago
Economic Growth Forecasts for G7 and BRICS Countries in 2024
-

 Wealth2 weeks ago
Charted: Which City Has the Most Billionaires in 2024?
-

 Technology2 weeks ago
All of the Grants Given by the U.S. CHIPS Act
-

 Green2 weeks ago
The Carbon Footprint of Major Travel Methods
-

 United States1 week ago
Visualizing the Most Common Pets in the U.S.
-

 Culture1 week ago
The World’s Top Media Franchises by All-Time Revenue
-

 voronoi1 week ago
Best Visualizations of April on the Voronoi App