Energy
Which Countries are Buying Russian Fossil Fuels?
![]() Subscribe to the Elements free mailing list for more like this
Subscribe to the Elements free mailing list for more like this
The Countries Buying Russian Fossil Fuels Since the Invasion
This was originally posted on Elements. Sign up to the free mailing list to get beautiful visualizations on natural resource megatrends in your email every week.
A year on from Russia’s initial invasion of Ukraine, Russian fossil fuel exports are still flowing to various nations around the world.
According to estimates from the Centre for Research on Energy and Clean Air (CREA), since the invasion started about a year ago, Russia has made more than $315 billion in revenue from fossil fuel exports around the world, with nearly half ($149 billion) coming from EU nations.
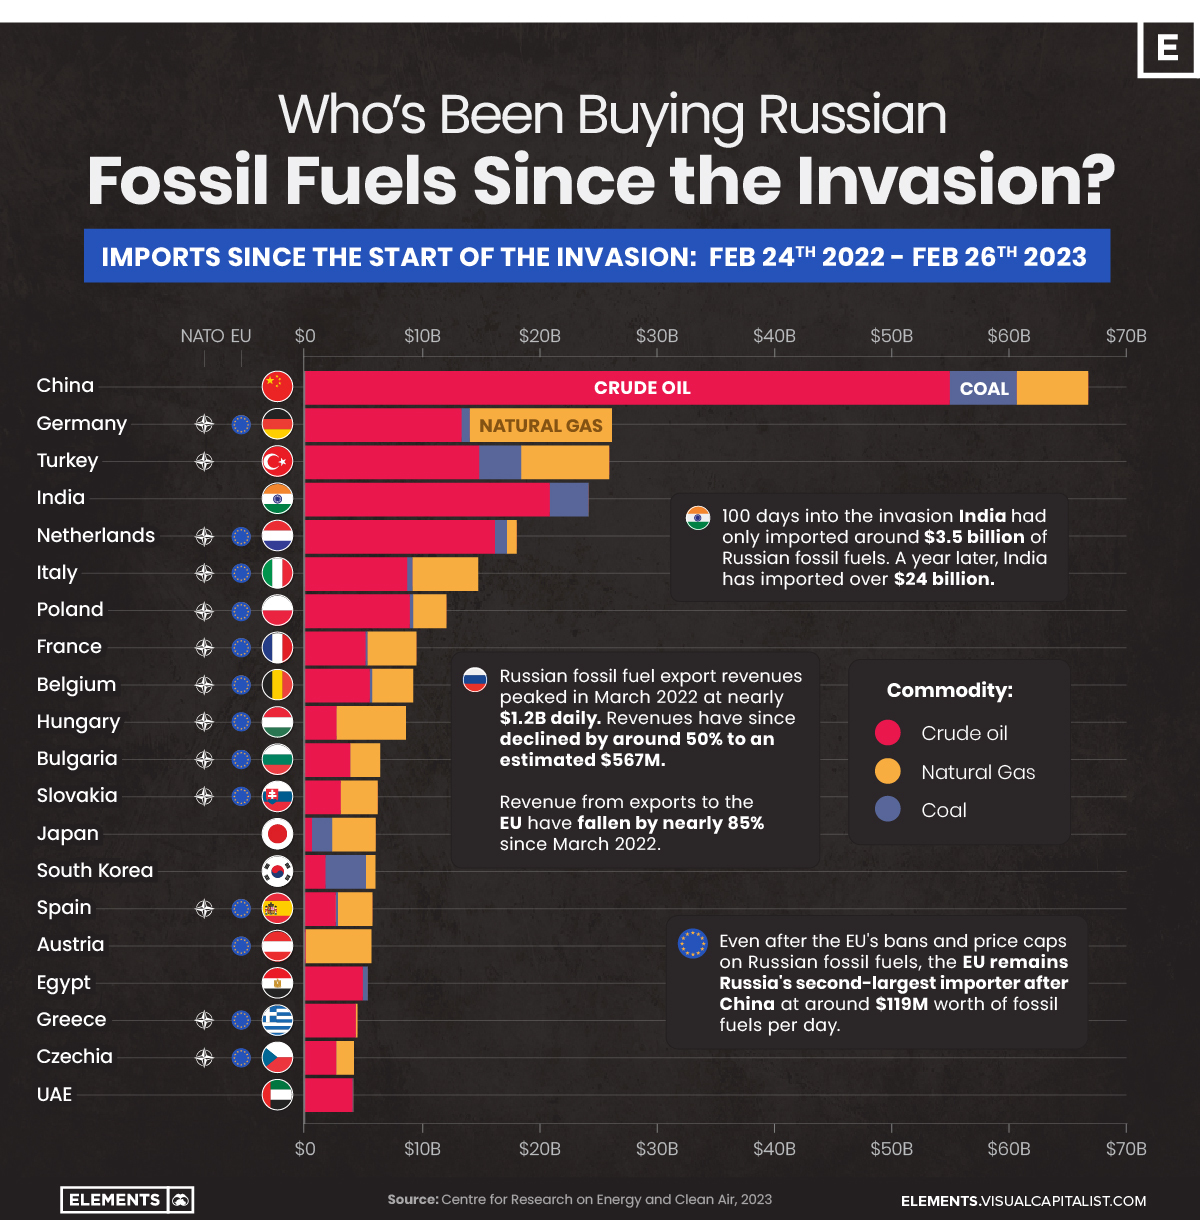
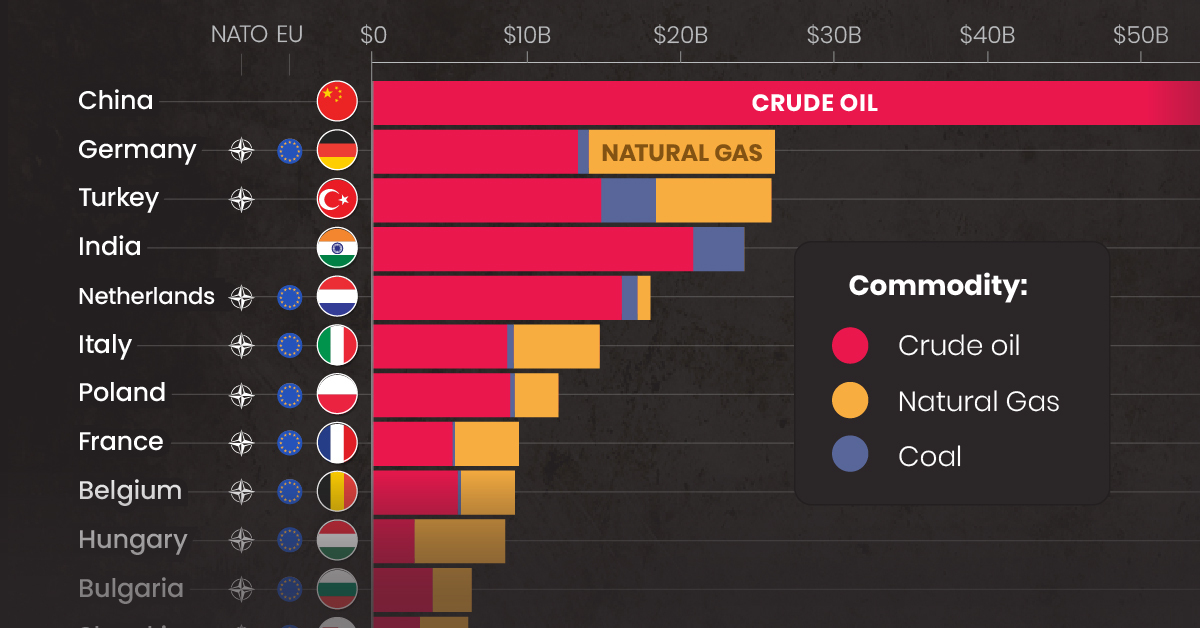
This graphic uses data from the CREA to visualize the countries that have bought the most Russian fossil fuels since the invasion, showcasing the billions in revenue Russia has made from these exports.
Top Importers of Russian Fossil Fuels
As one might expect, China has been the top buyer of Russian fossil fuels since the start of the invasion. Russia’s neighbor and informal ally has primarily imported crude oil, which has made up more than 80% of its imports totaling more than $55 billion since the start of the invasion.
The EU’s largest economy, Germany, is the second-largest importer of Russian fossil fuels, largely due to its natural gas imports worth more than $12 billion alone.
| Country | Total Value of Russian Fossil Fuel Imports* | Crude Oil | Natural Gas | Coal |
|---|---|---|---|---|
| 🇨🇳 China | $66.6B | $54.9B | $6.1B | $5.7B |
| 🇩🇪 Germany | $26.1B | $13.3B | $12.1B | $0.7B |
| 🇹🇷 Turkey | $25.9B | $14.8B | $7.5B | $3.6B |
| 🇮🇳 India | $24.1B | $20.8B | $0 | $3.3B |
| 🇳🇱 Netherlands | $18.0B | $16.2B | $0.8B | $1.0B |
| 🇮🇹 Italy | $14.8B | $8.7B | $5.6B | $0.4B |
| 🇵🇱 Poland | $12.1B | $8.9B | $2.9B | $0.3B |
| 🇫🇷 France | $9.5B | $5.2B | $4.2B | $0.2B |
| 🇧🇪 Belgium | $9.2B | $5.5B | $3.5B | $0.2B |
| 🇭🇺 Hungary | $8.6B | $2.7B | $5.9B | $0 |
| 🇧🇬 Bulgaria | $6.4B | $3.9B | $2.5B | $0 |
| 🇸🇰 Slovakia | $6.2B | $3.1B | $3.1B | $0 |
| 🇯🇵 Japan | $6.0B | $0.6B | $3.7B | $1.7B |
| 🇰🇷 South Korea | $6.0B | $1.8B | $0.8B | $3.5B |
| 🇪🇸 Spain | $5.8B | $2.7B | $2.9B | $0.2B |
| 🇦🇹 Austria | $5.7B | $0.1B | $5.6B | $0 |
| 🇪🇬 Egypt | $5.4B | $4.9B | $0 | $0.4B |
| 🇬🇷 Greece | $4.5B | $4.3B | $0.2B | $0 |
| 🇨🇿 Czechia | $4.2B | $2.7B | $1.5B | $0 |
| 🇦🇪 UAE | $4.1B | $4.1B | $0 | $0.1B |
*Over the time period of Feb 24, 2022 to Feb 26, 2023 in U.S. dollars
Turkey, a member of NATO but not of the EU, closely follows Germany as the third-largest importer of Russian fossil fuels since the invasion. The country is likely to overtake Germany soon, as not being part of the EU means it isn’t affected by the bloc’s Russian import bans put in place over the last year.
Although more than half of the top 20 fossil fuel importing nations are from the EU, nations from the bloc and the rest of Europe have been curtailing their imports as bans and price caps on Russian coal imports, crude oil seaborne shipments, and petroleum product imports have come into effect.
Russia’s Declining Fossil Fuel Revenues
The EU’s bans and price caps have resulted in a decline of daily fossil fuel revenues from the bloc of nearly 85%, falling from their March 2022 peak of $774 million per day to $119 million as of February 22nd, 2023.
Although India has stepped up its fossil fuel imports in the meantime, from $3 million daily on the day of the invasion to $81 million per day as of February 22nd of this year, this increase doesn’t come close to making up the $655 million hole left by EU nations’ reduction in imports.
Similarly, even if African nations have doubled their Russian fuel imports since December of last year, Russian seaborne oil product exports have still declined by 21% overall since January according to S&P Global.
Other Factors Impacting Revenues
Overall, from their peak on March 24th of around $1.17 billion in daily revenue, Russian fossil fuel revenues have declined by more than 50% to just $560 million daily.
Along with the EU’s reductions in purchases, a key contributing factor has been the decline in Russian crude oil’s price, which has also declined by nearly 50% since the invasion, from $99 a barrel to $50 a barrel today.
Whether these declines will continue is yet to be determined. That said, the EU’s 10th set of sanctions, announced on February 25th, ban the import of bitumen, related materials like asphalt, synthetic rubbers, and carbon blacks and are estimated to reduce overall Russian export revenues by almost $1.4 billion.


Energy
Charted: 4 Reasons Why Lithium Could Be the Next Gold Rush
Visual Capitalist has partnered with EnergyX to show why drops in prices and growing demand may make now the right time to invest in lithium.


4 Reasons Why You Should Invest in Lithium
Lithium’s importance in powering EVs makes it a linchpin of the clean energy transition and one of the world’s most precious minerals.
In this graphic, Visual Capitalist partnered with EnergyX to explore why now may be the time to invest in lithium.
1. Lithium Prices Have Dropped
One of the most critical aspects of evaluating an investment is ensuring that the asset’s value is higher than its price would indicate. Lithium is integral to powering EVs, and, prices have fallen fast over the last year:
| Date | LiOH·H₂O* | Li₂CO₃** |
|---|---|---|
| Feb 2023 | $76 | $71 |
| March 2023 | $71 | $61 |
| Apr 2023 | $43 | $33 |
| May 2023 | $43 | $33 |
| June 2023 | $47 | $45 |
| July 2023 | $44 | $40 |
| Aug 2023 | $35 | $35 |
| Sept 2023 | $28 | $27 |
| Oct 2023 | $24 | $23 |
| Nov 2023 | $21 | $21 |
| Dec 2023 | $17 | $16 |
| Jan 2024 | $14 | $15 |
| Feb 2024 | $13 | $14 |
Note: Monthly spot prices were taken as close to the 14th of each month as possible.
*Lithium hydroxide monohydrate MB-LI-0033
**Lithium carbonate MB-LI-0029
2. Lithium-Ion Battery Prices Are Also Falling
The drop in lithium prices is just one reason to invest in the metal. Increasing economies of scale, coupled with low commodity prices, have caused the cost of lithium-ion batteries to drop significantly as well.
In fact, BNEF reports that between 2013 and 2023, the price of a Li-ion battery dropped by 82%.
| Year | Price per KWh |
|---|---|
| 2023 | $139 |
| 2022 | $161 |
| 2021 | $150 |
| 2020 | $160 |
| 2019 | $183 |
| 2018 | $211 |
| 2017 | $258 |
| 2016 | $345 |
| 2015 | $448 |
| 2014 | $692 |
| 2013 | $780 |

3. EV Adoption is Sustainable
One of the best reasons to invest in lithium is that EVs, one of the main drivers behind the demand for lithium, have reached a price point similar to that of traditional vehicle.
According to the Kelly Blue Book, Tesla’s average transaction price dropped by 25% between 2022 and 2023, bringing it in line with many other major manufacturers and showing that EVs are a realistic transport option from a consumer price perspective.
| Manufacturer | September 2022 | September 2023 |
|---|---|---|
| BMW | $69,000 | $72,000 |
| Ford | $54,000 | $56,000 |
| Volkswagon | $54,000 | $56,000 |
| General Motors | $52,000 | $53,000 |
| Tesla | $68,000 | $51,000 |
4. Electricity Demand in Transport is Growing
As EVs become an accessible transport option, there’s an investment opportunity in lithium. But possibly the best reason to invest in lithium is that the IEA reports global demand for the electricity in transport could grow dramatically by 2030:
| Transport Type | 2022 | 2025 | 2030 |
|---|---|---|---|
| Buses 🚌 | 23,000 GWh | 50,000 GWh | 130,000 GWh |
| Cars 🚙 | 65,000 GWh | 200,000 GWh | 570,000 GWh |
| Trucks 🛻 | 4,000 GWh | 15,000 GWh | 94,000 GWh |
| Vans 🚐 | 6,000 GWh | 16,000 GWh | 72,000 GWh |
The Lithium Investment Opportunity
Lithium presents a potentially classic investment opportunity. Lithium and battery prices have dropped significantly, and recently, EVs have reached a price point similar to other vehicles. By 2030, the demand for clean energy, especially in transport, will grow dramatically.
With prices dropping and demand skyrocketing, now is the time to invest in lithium.
EnergyX is poised to exploit lithium demand with cutting-edge lithium extraction technology capable of extracting 300% more lithium than current processes.

-

 Lithium4 days ago
Ranked: The Top 10 EV Battery Manufacturers in 2023
Asia dominates this ranking of the world’s largest EV battery manufacturers in 2023.
-

 Energy1 week ago
The World’s Biggest Nuclear Energy Producers
China has grown its nuclear capacity over the last decade, now ranking second on the list of top nuclear energy producers.
-

 Energy1 month ago
The World’s Biggest Oil Producers in 2023
Just three countries accounted for 40% of global oil production last year.
-

 Energy1 month ago
How Much Does the U.S. Depend on Russian Uranium?
Currently, Russia is the largest foreign supplier of nuclear power fuel to the U.S.
-

 Uranium2 months ago
Charted: Global Uranium Reserves, by Country
We visualize the distribution of the world’s uranium reserves by country, with 3 countries accounting for more than half of total reserves.
-

 Energy3 months ago
Visualizing the Rise of the U.S. as Top Crude Oil Producer
Over the last decade, the United States has established itself as the world’s top producer of crude oil, surpassing Saudi Arabia and Russia.


-

 Debt1 week ago
How Debt-to-GDP Ratios Have Changed Since 2000
-

 Markets2 weeks ago
Ranked: The World’s Top Flight Routes, by Revenue
-

 Countries2 weeks ago
Population Projections: The World’s 6 Largest Countries in 2075
-

 Markets2 weeks ago
The Top 10 States by Real GDP Growth in 2023
-

 Demographics2 weeks ago
The Smallest Gender Wage Gaps in OECD Countries
-

 United States2 weeks ago
Where U.S. Inflation Hit the Hardest in March 2024
-

 Green2 weeks ago
Top Countries By Forest Growth Since 2001
-

 United States2 weeks ago
Ranked: The Largest U.S. Corporations by Number of Employees