Energy
Mapped: Asia’s Biggest Sources of Electricity by Country
![]() Subscribe to the Elements free mailing list for more like this
Subscribe to the Elements free mailing list for more like this
Mapped: Asia’s Biggest Sources of Electricity by Country
This was originally posted on Elements. Sign up to the free mailing list to get beautiful visualizations on natural resource megatrends in your email every week.
The International Energy Agency (IEA) predicts that Asia will account for half of the world’s electricity consumption by 2025, with one-third of global electricity being consumed in China.
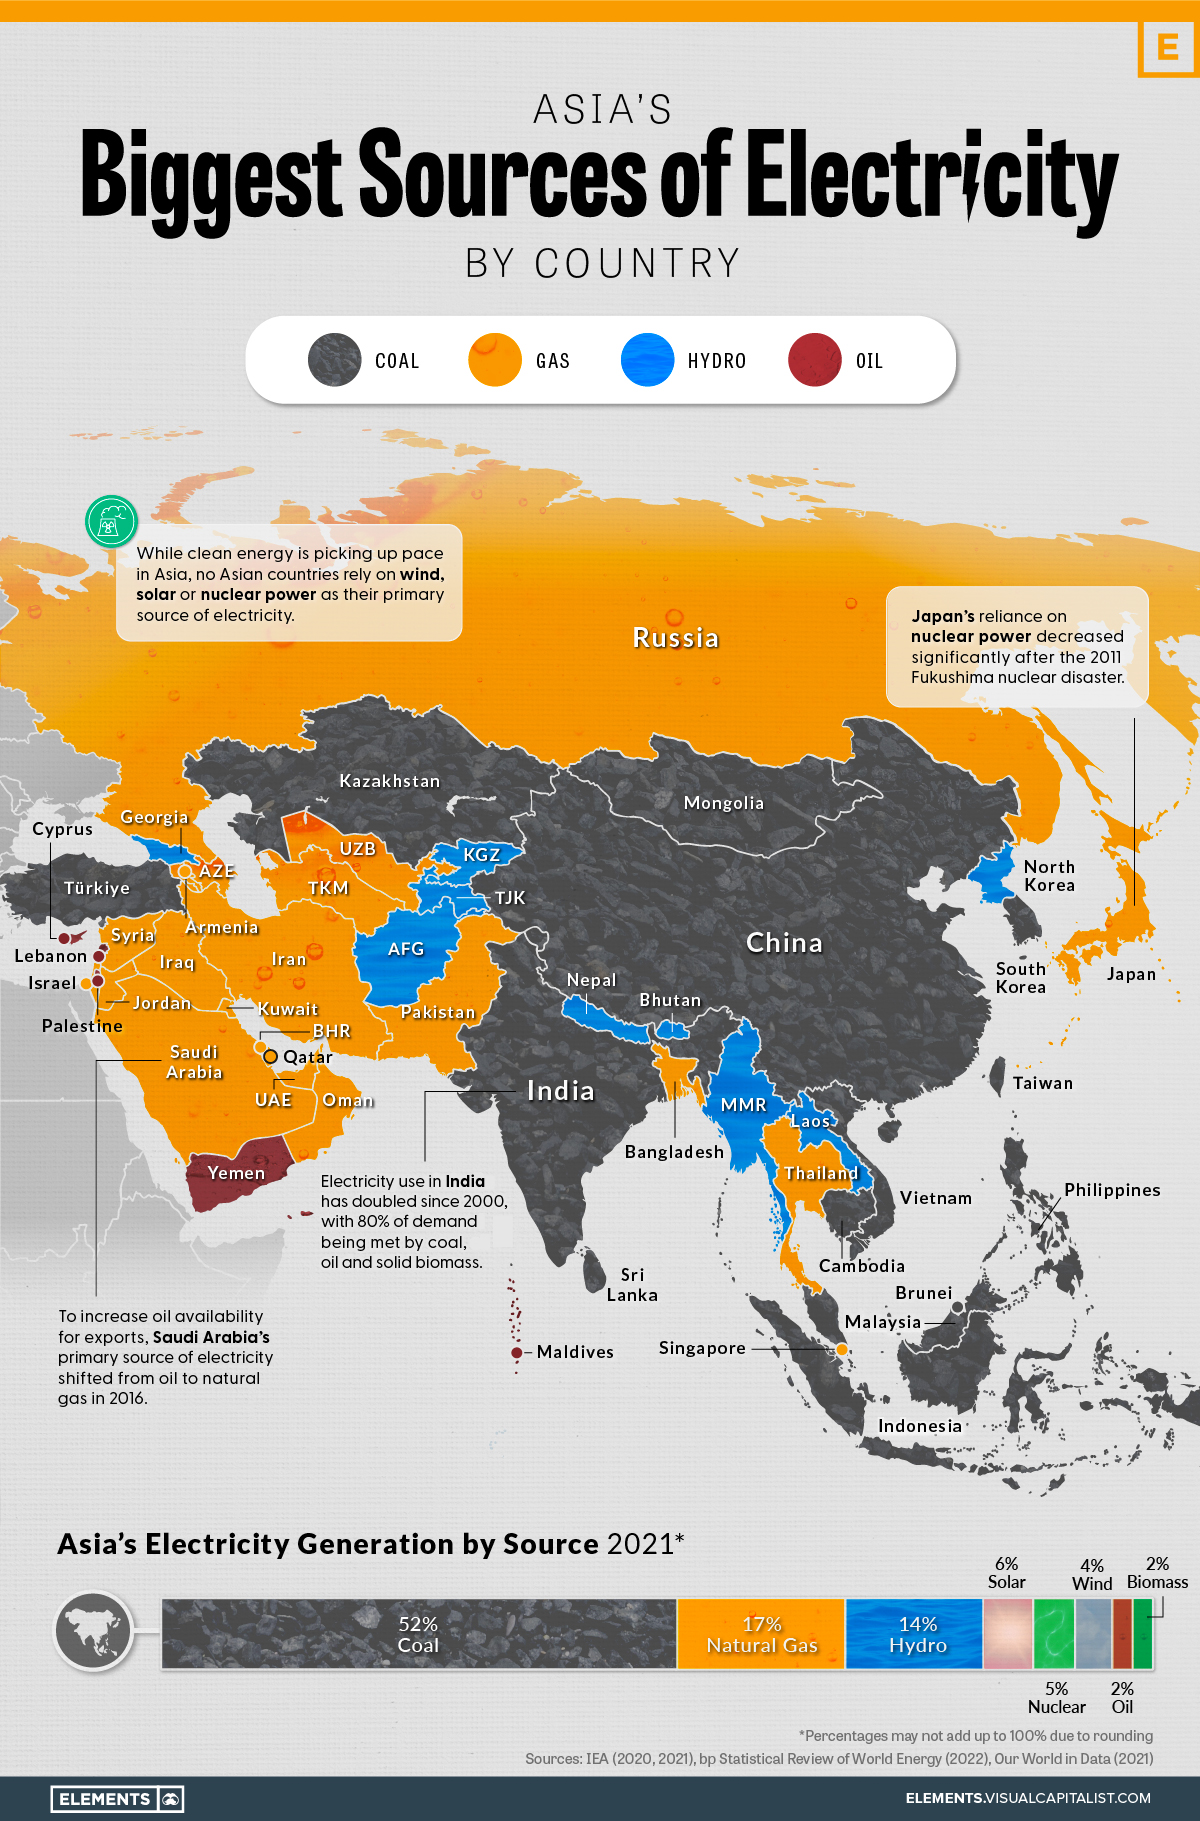
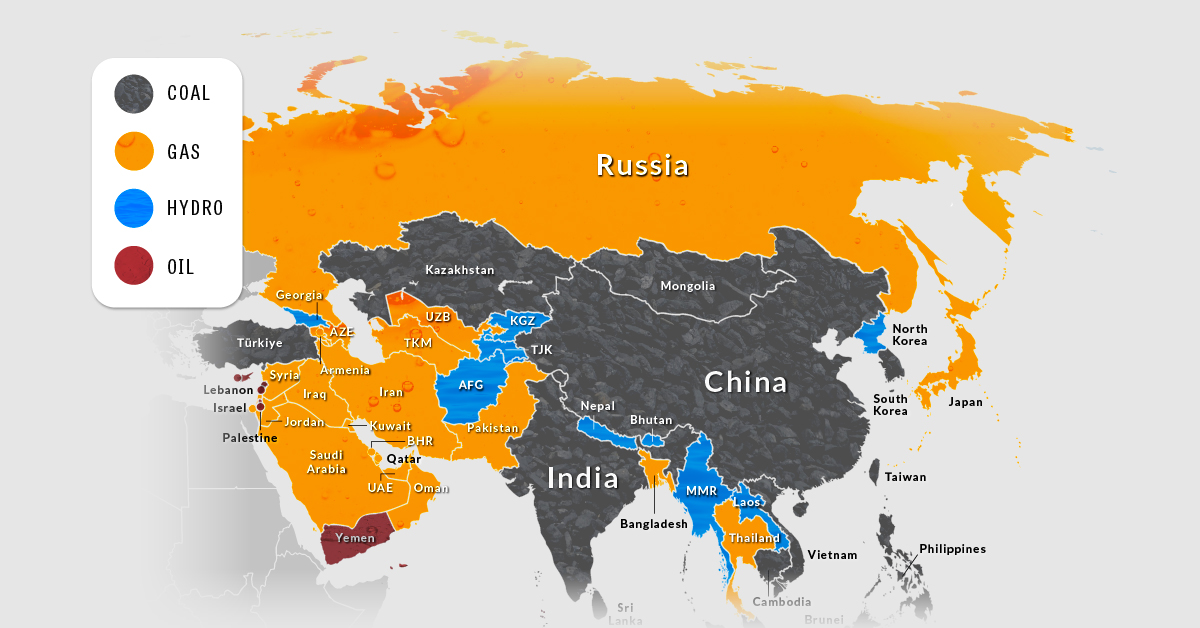
To explore how this growing electricity demand is currently being met, the above graphic maps out Asia’s main sources of electricity by country, using data from the BP Statistical Review of World Energy and the IEA.
A Coal-Heavy Electricity Mix
Although clean energy has been picking up pace in Asia, coal currently makes up more than half of the continent’s electricity generation.
No Asian countries rely on wind, solar, or nuclear energy as their primary source of electricity, despite the combined share of these sources doubling over the last decade.
| % of total electricity mix, 2011 | % of total electricity mix, 2021 | |
|---|---|---|
| Coal | 55% | 52% |
| Natural Gas | 19% | 17% |
| Hydro | 12% | 14% |
| Nuclear | 5% | 5% |
| Wind | 1% | 4% |
| Solar | 0% | 4% |
| Oil | 6% | 2% |
| Biomass | 1% | 2% |
| Total Electricity Generated | 9,780 terawatt-hours | 15,370 terawatt-hours |
The above comparison shows that the slight drops in the continent’s reliance on coal, natural gas, and oil in the last decade have been absorbed by wind, solar, and hydropower. The vast growth in total electricity generated, however, means that a lot more fossil fuels are being burned now (in absolute terms) than at the start of the last decade, despite their shares dropping.
Following coal, natural gas comes in second place as Asia’s most used electricity source, with most of this demand coming from the Middle East and Russia.
Zooming in: China’s Big Electricity Demand
While China accounted for just 5% of global electricity demand in 1990, it is en route to account for 33% by 2025. The country is already the largest electricity producer in the world by far, annually generating nearly double the electricity produced by the second largest electricity producer in the world, the United States.
With such a large demand, the current source of China’s electricity is worthy of consideration, as are its plans for its future electricity mix.
Currently, China is one of the 14 Asian countries that rely on coal as its primary source of electricity. In 2021, the country drew 62% of its electricity from coal, a total of 5,339 TWh of energy. To put that into perspective, this is approximately three times all of the electricity generated in India in the same year.
Following coal, the remainder of China’s electricity mix is as follows.
| Source | % of total electricity mix (China, 2021) |
|---|---|
| Coal | 62% |
| Hydropower | 15% |
| Wind | 8% |
| Nuclear | 5% |
| Solar | 4% |
| Natural Gas | 3% |
| Biomass | 2% |
Despite already growing by 1.5x in the last decade, China’s demand for electricity is still growing. Recent developments in the country’s clean energy infrastructure point to most of this growth being met by renewables.
China does also have ambitious plans in place for its clean energy transition beyond the next few years. These include increasing its solar capacity by 667% between 2025 and 2060, as well as having wind as its primary source of electricity by 2060.
Asia’s Road to Clean Energy
According to the IEA, the world reached a new all-time high in power generation-related emissions in 2022, primarily as a result of the growth in fossil-fuel-generated electricity in the Asia Pacific.
With that said, these emissions are set to plateau by 2025, with a lot of the global growth in renewables and nuclear power being seen in Asia.
Currently, nuclear power is of particular interest in the continent, especially with 2022’s energy crisis highlighting the need for energy independence and security. India, for instance, is set to have an 80% growth in its nuclear electricity generation in the next two years, with Japan, South Korea, and China following suit in increasing their nuclear capacity.
The road ahead also hints at other interesting insights, specifically when it comes to hydropower in Asia. With heatwaves and droughts becoming more and more commonplace as a result of climate change, the continent may be poised to learn some lessons from Europe’s record-low hydropower generation in 2022, diverting its time and resources to other forms of clean energy, like wind and solar.
Whatever the future holds, one thing is clear: with ambitious plans already underway, Asia’s electricity mix may look significantly different within the next few decades.


Energy
Charted: 4 Reasons Why Lithium Could Be the Next Gold Rush
Visual Capitalist has partnered with EnergyX to show why drops in prices and growing demand may make now the right time to invest in lithium.


4 Reasons Why You Should Invest in Lithium
Lithium’s importance in powering EVs makes it a linchpin of the clean energy transition and one of the world’s most precious minerals.
In this graphic, Visual Capitalist partnered with EnergyX to explore why now may be the time to invest in lithium.
1. Lithium Prices Have Dropped
One of the most critical aspects of evaluating an investment is ensuring that the asset’s value is higher than its price would indicate. Lithium is integral to powering EVs, and, prices have fallen fast over the last year:
| Date | LiOH·H₂O* | Li₂CO₃** |
|---|---|---|
| Feb 2023 | $76 | $71 |
| March 2023 | $71 | $61 |
| Apr 2023 | $43 | $33 |
| May 2023 | $43 | $33 |
| June 2023 | $47 | $45 |
| July 2023 | $44 | $40 |
| Aug 2023 | $35 | $35 |
| Sept 2023 | $28 | $27 |
| Oct 2023 | $24 | $23 |
| Nov 2023 | $21 | $21 |
| Dec 2023 | $17 | $16 |
| Jan 2024 | $14 | $15 |
| Feb 2024 | $13 | $14 |
Note: Monthly spot prices were taken as close to the 14th of each month as possible.
*Lithium hydroxide monohydrate MB-LI-0033
**Lithium carbonate MB-LI-0029
2. Lithium-Ion Battery Prices Are Also Falling
The drop in lithium prices is just one reason to invest in the metal. Increasing economies of scale, coupled with low commodity prices, have caused the cost of lithium-ion batteries to drop significantly as well.
In fact, BNEF reports that between 2013 and 2023, the price of a Li-ion battery dropped by 82%.
| Year | Price per KWh |
|---|---|
| 2023 | $139 |
| 2022 | $161 |
| 2021 | $150 |
| 2020 | $160 |
| 2019 | $183 |
| 2018 | $211 |
| 2017 | $258 |
| 2016 | $345 |
| 2015 | $448 |
| 2014 | $692 |
| 2013 | $780 |

3. EV Adoption is Sustainable
One of the best reasons to invest in lithium is that EVs, one of the main drivers behind the demand for lithium, have reached a price point similar to that of traditional vehicle.
According to the Kelly Blue Book, Tesla’s average transaction price dropped by 25% between 2022 and 2023, bringing it in line with many other major manufacturers and showing that EVs are a realistic transport option from a consumer price perspective.
| Manufacturer | September 2022 | September 2023 |
|---|---|---|
| BMW | $69,000 | $72,000 |
| Ford | $54,000 | $56,000 |
| Volkswagon | $54,000 | $56,000 |
| General Motors | $52,000 | $53,000 |
| Tesla | $68,000 | $51,000 |
4. Electricity Demand in Transport is Growing
As EVs become an accessible transport option, there’s an investment opportunity in lithium. But possibly the best reason to invest in lithium is that the IEA reports global demand for the electricity in transport could grow dramatically by 2030:
| Transport Type | 2022 | 2025 | 2030 |
|---|---|---|---|
| Buses 🚌 | 23,000 GWh | 50,000 GWh | 130,000 GWh |
| Cars 🚙 | 65,000 GWh | 200,000 GWh | 570,000 GWh |
| Trucks 🛻 | 4,000 GWh | 15,000 GWh | 94,000 GWh |
| Vans 🚐 | 6,000 GWh | 16,000 GWh | 72,000 GWh |
The Lithium Investment Opportunity
Lithium presents a potentially classic investment opportunity. Lithium and battery prices have dropped significantly, and recently, EVs have reached a price point similar to other vehicles. By 2030, the demand for clean energy, especially in transport, will grow dramatically.
With prices dropping and demand skyrocketing, now is the time to invest in lithium.
EnergyX is poised to exploit lithium demand with cutting-edge lithium extraction technology capable of extracting 300% more lithium than current processes.

-

 Lithium5 days ago
Ranked: The Top 10 EV Battery Manufacturers in 2023
Asia dominates this ranking of the world’s largest EV battery manufacturers in 2023.
-

 Energy1 week ago
The World’s Biggest Nuclear Energy Producers
China has grown its nuclear capacity over the last decade, now ranking second on the list of top nuclear energy producers.
-

 Energy1 month ago
The World’s Biggest Oil Producers in 2023
Just three countries accounted for 40% of global oil production last year.
-

 Energy1 month ago
How Much Does the U.S. Depend on Russian Uranium?
Currently, Russia is the largest foreign supplier of nuclear power fuel to the U.S.
-

 Uranium2 months ago
Charted: Global Uranium Reserves, by Country
We visualize the distribution of the world’s uranium reserves by country, with 3 countries accounting for more than half of total reserves.
-

 Energy3 months ago
Visualizing the Rise of the U.S. as Top Crude Oil Producer
Over the last decade, the United States has established itself as the world’s top producer of crude oil, surpassing Saudi Arabia and Russia.

-

 Debt1 week ago
How Debt-to-GDP Ratios Have Changed Since 2000
-

 Markets2 weeks ago
Ranked: The World’s Top Flight Routes, by Revenue
-

 Countries2 weeks ago
Population Projections: The World’s 6 Largest Countries in 2075
-

 Markets2 weeks ago
The Top 10 States by Real GDP Growth in 2023
-

 Demographics2 weeks ago
The Smallest Gender Wage Gaps in OECD Countries
-

 United States2 weeks ago
Where U.S. Inflation Hit the Hardest in March 2024
-

 Green2 weeks ago
Top Countries By Forest Growth Since 2001
-

 United States2 weeks ago
Ranked: The Largest U.S. Corporations by Number of Employees