Water
Mapping the World’s River Basins by Continent
Article/Editing:
There are hundreds of rivers on Earth’s surface, moving freshwater from hills and mountains down to larger rivers, lakes, and oceans.
Thanks to the planet’s natural slopes and ridges, falling rain that isn’t absorbed by soil or evaporated also ends up in nearby rivers. This area—where all flowing surface water converges—is called a river basin, drainage basin, or watershed.
These maps by Adam Symington show the world’s many rivers and major river basins, using the HydroSHEDS database and broken down by continent.
Mapping River Basins By Continent
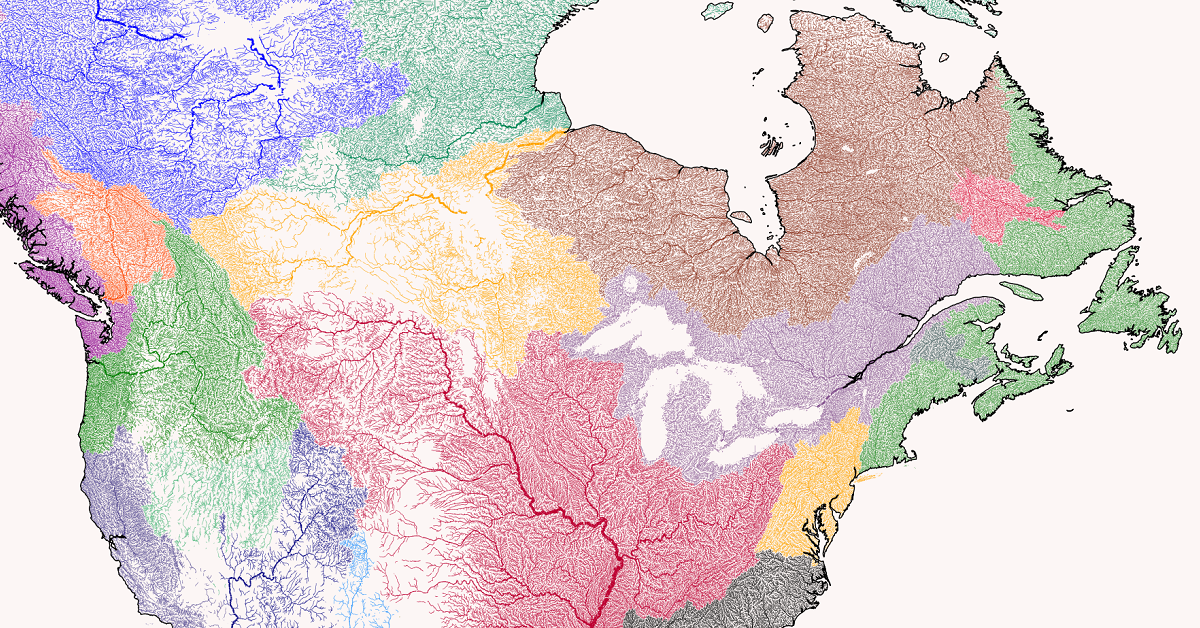
The Americas
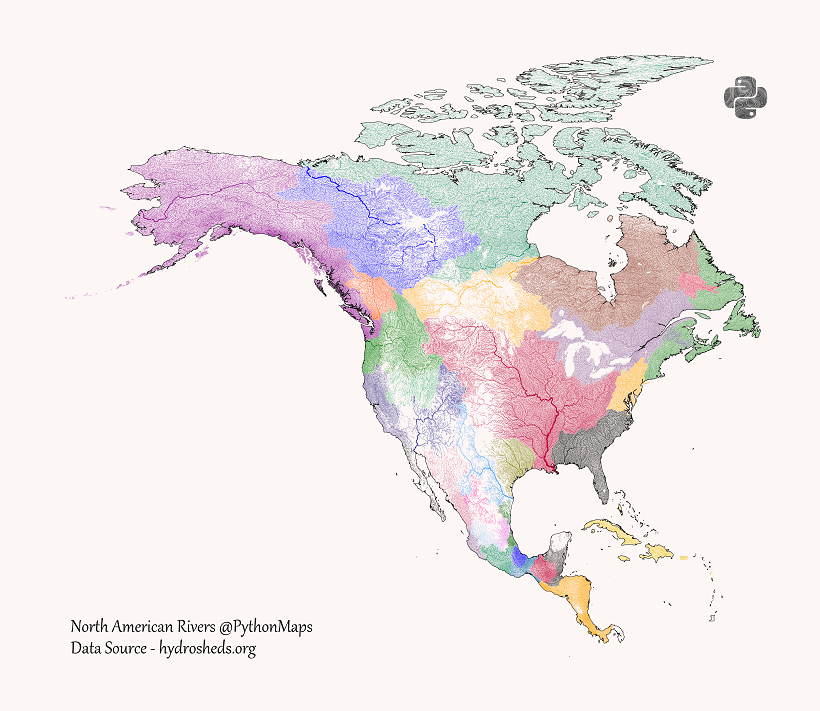
North and Central America have many different river basins, but a few major rivers stand out.
To the North, Canada’s Mackenzie River runs from British Columbia through the Northwest Territories and ending up at the Arctic Ocean.
Of course, the Mississippi River and the Missouri River which flows into it both stand out as well, draining water from much of the U.S. to the Gulf of Mexico.
A few rivers and basins also start in the U.S. and end up in Mexico, including the Rio Grande from Colorado to Tamaulipas. Further south in Central America and the Caribbean, most of the basins don’t have major rivers and empty into the nearby oceans.
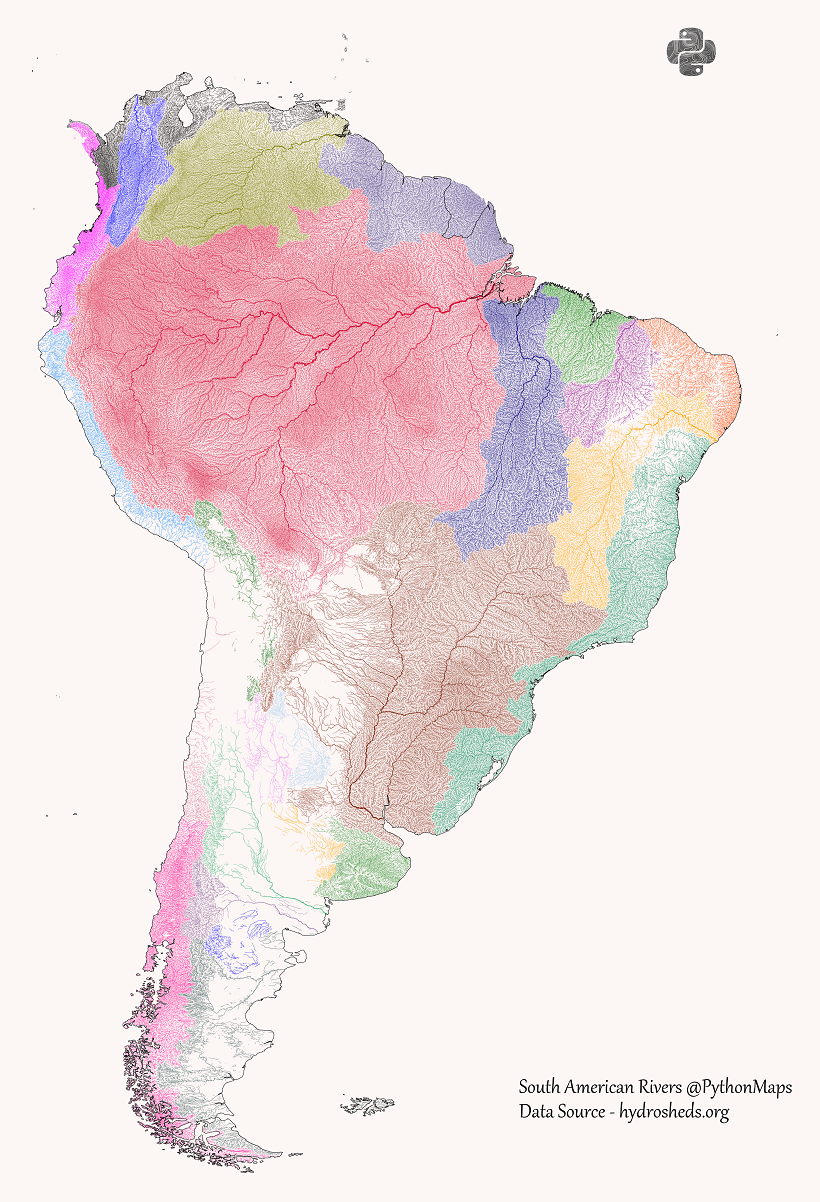
It’s well-known that the Amazon River is the largest river in the world by volume and the second largest by length.
Likewise, its reach and impact can be seen in these maps. The Amazon basin is the largest river basin in the world with an area of 6,300,000 km², covering just over one-third of the entire South American continent.
That is almost double the sizable Río de la Plata basin, the 5th largest river basin in the world, which includes the Uruguay River and the Paraná River and meets at the border between Uruguay and Argentina.
Europe and Africa
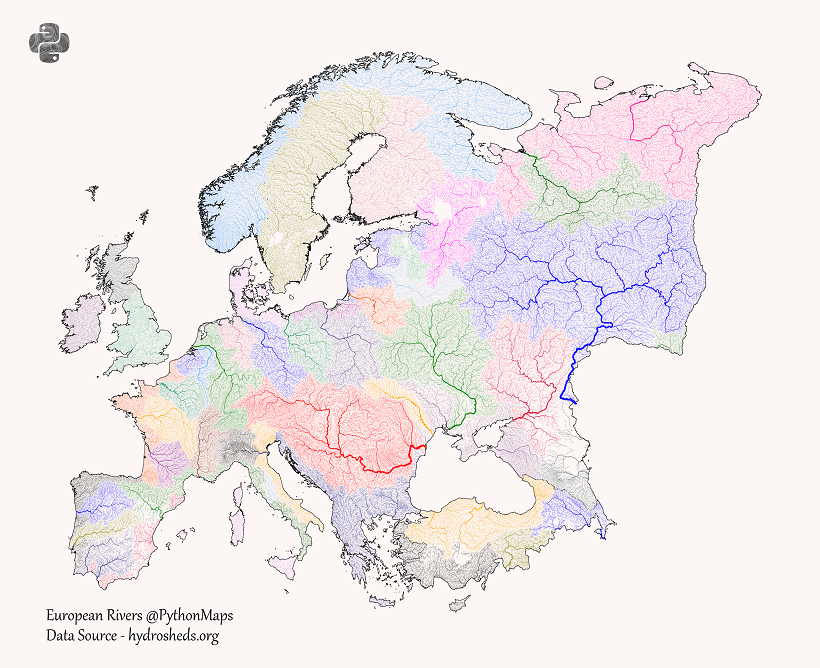
Despite being the second smallest continent, Europe’s proximity to many different bodies of water and great variation of terrain in small areas gives it many different drainage basins.
But a few notable rivers stand out in Central and Eastern Europe. The Danube, a historically important trade route and once a frontier of the Roman Empire, originates in Germany and flows eastwards to the Black Sea, passing through 10 total countries.
The longest river in Europe, the Volga in Russia, is also the cornerstone of the continent’s largest river basin, draining into the Caspian Sea. Its tributaries include the Moskva which runs through Moscow in Western Russia before flowing eastwards.
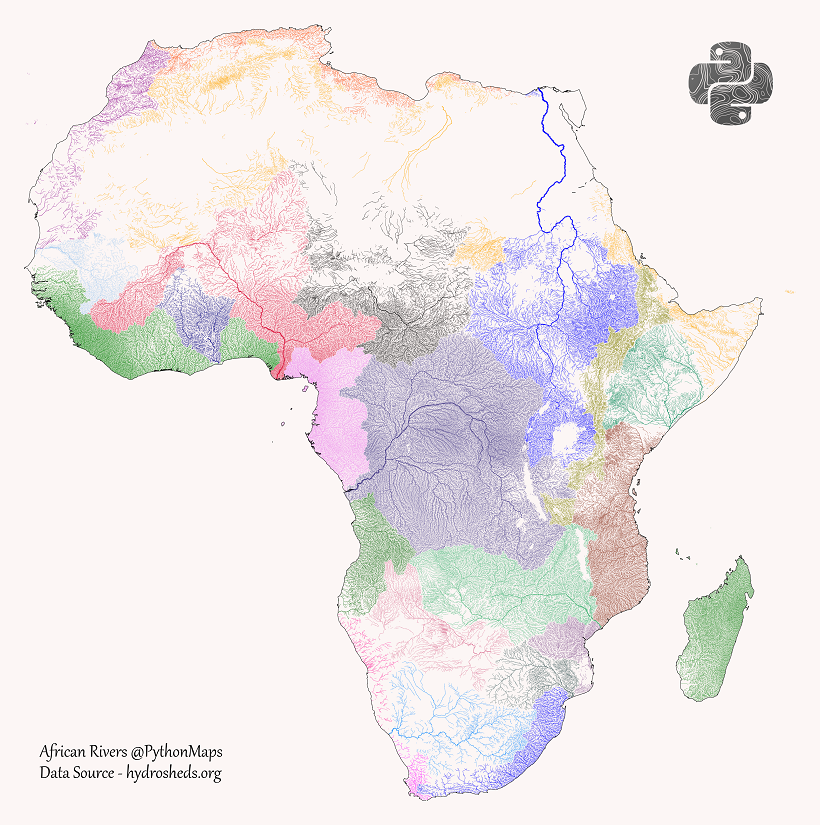
One of Africa’s most notable features is the lack of drainage in the Sahara Desert. But the continent also has a few clear major river systems, including two of the world’s largest rivers.
In the northeast, the Nile River is the world’s longest river, flowing from Lake Victoria and Lake Tana in the south to Egypt and the Mediterranean Sea. In total, its basin covers 11 countries.
In Central Africa, the Congo River (formerly the Zaire River) is the second largest river in the world by volume. It also is central to the Congo Basin, the second largest river basin with an area of 4,014,500 km².
And in West Africa, the Niger River creates a crescent shaped basin from the Guinea Highlands, northeast to Mali, then southwest through Niger and Nigeria. It ends in the massive (and massively important and populated) Niger Delta.
Asia and Oceania
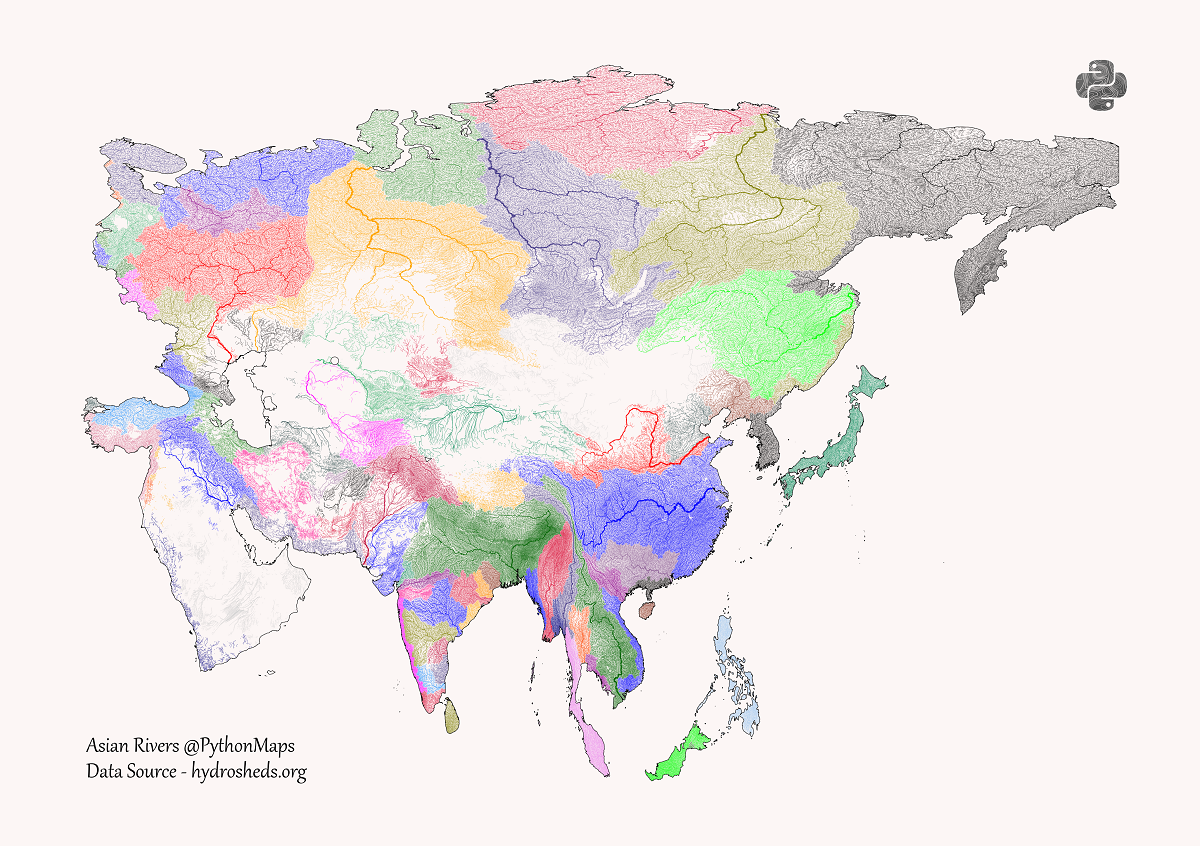
The world’s largest continent also has one of the largest varieties of river basins. From large sweeping basins in North Asia, to deserts in mountainous Central Asia and the Arabian Peninsula, to the multitude of basins draining into the Indian Ocean.
One of the major standouts is the Yangtze in China, the world’s third-longest river and largest plastic emitting river. Flowing from the Tibetan Plateau to the East China Sea, its wide basin covers one-fifth of China’s land area and one-third of its population.
The largest by volume is the Ganges–Brahmaputra–Meghna system, three major rivers running through India, China, Nepal, and Bangladesh. Their combined basin is home to around 400 million people, making it the most populous river basin in the world, ultimately draining into the Ganges Delta and ending up at the Bay of Bengal.
But the largest river basins in Asia are those of the “great Siberian rivers,” the Ob, the Yenisei, and the Lena, which all flow north to the Arctic Ocean.
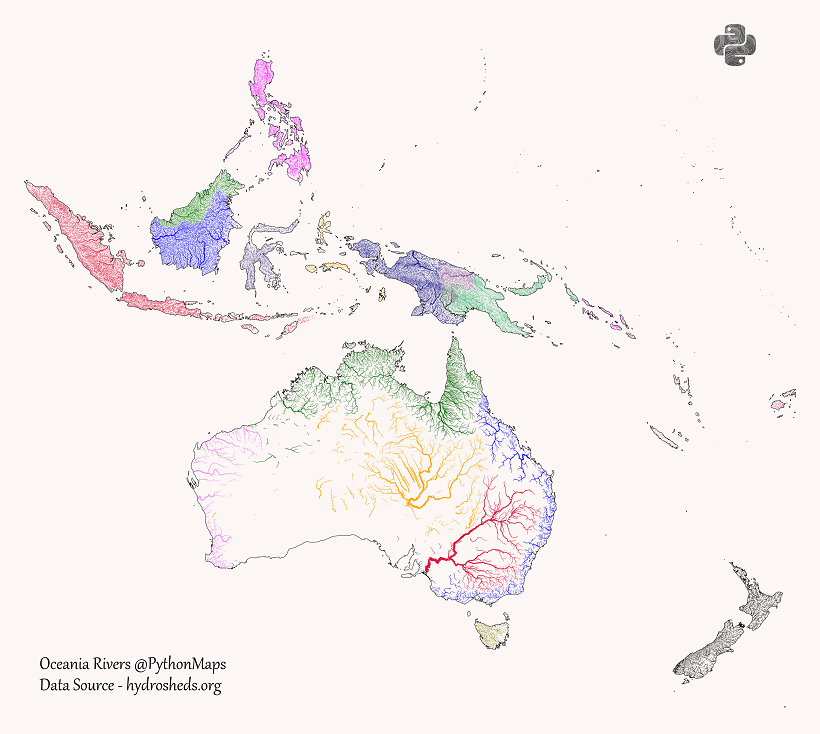
Comprised of many archipelagos and islands with a high ratio of coast along the Pacific Ocean, Oceania understandably has fewer long rivers and major river basins.
But there are still a few standouts, especially in the deserts of Australia. The Murray–Darling basin in the country’s southeast includes six of Australia’s seven longest rivers (including the namesake Murray), draining west to the Southern Ocean near Adelaide.
Towards the center of the country is the Lake Eyre basin, which covers 1,210,000 km² or just under one-sixth of the country’s landmass. This mostly flat and often dry basin drains into Lake Eyre, Australia’s largest lake, which only fills up with water about four times a century.
If you want to see higher resolution versions of these maps and do more river exploration for yourself, head to the PythonMaps Twitter. For full-size prints, check out the PythonMaps Etsy.

This article was published as a part of Visual Capitalist's Creator Program, which features data-driven visuals from some of our favorite Creators around the world.


Green
Tracking Antarctica Sea Ice Loss in 2023
Antarctica’s ice extent has reached record lows. This visual details and maps Antarctica sea ice loss over the last two years.
Tracking Antarctica Sea Ice Loss in 2023
Scientists have been tracking the extent and concentrations of Antarctica’s sea ice for decades, and the last two years have raised global alarm bells.
As temperatures are breaking records around the world, the southernmost continent’s ice sheet is visibly smaller than it has been in decades past.
The above graphic uses tracking data from the National Oceanic and Atmospheric Administration (NOAA) and the National Snow and Ice Data Center (NSIDC) to visualize sea ice extent in Antarctica as of August 2023
How Much Ice Has Antarctica Lost?
According to satellite data tracked by the NSIDC, sea ice extent in Antarctica has shrunk to record lows.
When compared to previously charted data dating back to 1979, daily record lows in sea ice extent have been recorded for every day in 2023 so far.
Here is how daily Antarctic sea ice extent in 2023 compares to 2022 (which had many of the previous record lows), and the median from 1981 to 2010.
| Date | 2023 (km²) | 2022 (km²) | Median (1981‒2010, km²) |
|---|---|---|---|
| Aug 24 | 15.87M | 17.29M | 17.94M |
| Aug 23 | 15.79M | 17.24M | 17.91M |
| Aug 22 | 15.74M | 17.21M | 17.89M |
| Aug 21 | 15.69M | 17.19M | 17.87M |
| Aug 20 | 15.64M | 17.14M | 17.84M |
| Aug 19 | 15.55M | 17.11M | 17.82M |
| Aug 18 | 15.45M | 17.06M | 17.79M |
| Aug 17 | 15.34M | 16.99M | 17.73M |
| Aug 16 | 15.22M | 16.93M | 17.68M |
| Aug 15 | 15.12M | 16.88M | 17.63M |
| Aug 14 | 15.07M | 16.84M | 17.60M |
| Aug 13 | 15.04M | 16.81M | 17.56M |
| Aug 12 | 15.02M | 16.78M | 17.54M |
| Aug 11 | 15.00M | 16.76M | 17.50M |
| Aug 10 | 14.98M | 16.75M | 17.45M |
| Aug 09 | 14.96M | 16.73M | 17.39M |
| Aug 08 | 14.95M | 16.70M | 17.34M |
| Aug 07 | 14.92M | 16.64M | 17.27M |
| Aug 06 | 14.88M | 16.57M | 17.21M |
| Aug 05 | 14.86M | 16.46M | 17.15M |
| Aug 04 | 14.82M | 16.35M | 17.10M |
| Aug 03 | 14.78M | 16.22M | 17.05M |
| Aug 02 | 14.75M | 16.11M | 17.01M |
| Aug 01 | 14.69M | 15.99M | 16.96M |
| Jul 31 | 14.62M | 15.87M | 16.92M |
| Jul 30 | 14.55M | 15.76M | 16.86M |
| Jul 29 | 14.47M | 15.68M | 16.79M |
| Jul 28 | 14.38M | 15.62M | 16.71M |
| Jul 27 | 14.29M | 15.59M | 16.63M |
| Jul 26 | 14.21M | 15.57M | 16.56M |
| Jul 25 | 14.16M | 15.56M | 16.49M |
| Jul 24 | 14.10M | 15.53M | 16.41M |
| Jul 23 | 14.03M | 15.50M | 16.33M |
| Jul 22 | 13.97M | 15.43M | 16.24M |
| Jul 21 | 13.91M | 15.35M | 16.16M |
| Jul 20 | 13.82M | 15.25M | 16.08M |
| Jul 19 | 13.70M | 15.14M | 16.00M |
| Jul 18 | 13.58M | 15.03M | 15.94M |
| Jul 17 | 13.45M | 14.93M | 15.88M |
| Jul 16 | 13.31M | 14.84M | 15.80M |
| Jul 15 | 13.17M | 14.78M | 15.71M |
| Jul 14 | 13.07M | 14.72M | 15.62M |
| Jul 13 | 12.98M | 14.64M | 15.54M |
| Jul 12 | 12.88M | 14.57M | 15.46M |
| Jul 11 | 12.77M | 14.47M | 15.39M |
| Jul 10 | 12.65M | 14.37M | 15.32M |
| Jul 09 | 12.54M | 14.28M | 15.25M |
| Jul 08 | 12.43M | 14.19M | 15.19M |
| Jul 07 | 12.36M | 14.12M | 15.12M |
| Jul 06 | 12.32M | 14.06M | 15.05M |
| Jul 05 | 12.31M | 13.98M | 14.98M |
| Jul 04 | 12.28M | 13.89M | 14.91M |
| Jul 03 | 12.22M | 13.79M | 14.82M |
| Jul 02 | 12.14M | 13.68M | 14.73M |
| Jul 01 | 12.06M | 13.58M | 14.64M |
| Jun 30 | 11.96M | 13.46M | 14.54M |
| Jun 29 | 11.87M | 13.33M | 14.45M |
| Jun 28 | 11.81M | 13.19M | 14.36M |
| Jun 27 | 11.75M | 13.06M | 14.26M |
| Jun 26 | 11.68M | 12.92M | 14.17M |
| Jun 25 | 11.61M | 12.81M | 14.07M |
| Jun 24 | 11.53M | 12.73M | 13.98M |
| Jun 23 | 11.46M | 12.67M | 13.88M |
| Jun 22 | 11.39M | 12.61M | 13.79M |
| Jun 21 | 11.31M | 12.56M | 13.69M |
| Jun 20 | 11.21M | 12.50M | 13.59M |
| Jun 19 | 11.10M | 12.41M | 13.48M |
| Jun 18 | 11.02M | 12.32M | 13.37M |
| Jun 17 | 10.92M | 12.22M | 13.26M |
| Jun 16 | 10.84M | 12.11M | 13.17M |
| Jun 15 | 10.78M | 12.02M | 13.08M |
| Jun 14 | 10.73M | 11.92M | 12.98M |
| Jun 13 | 10.66M | 11.81M | 12.89M |
| Jun 12 | 10.61M | 11.72M | 12.81M |
| Jun 11 | 10.54M | 11.62M | 12.72M |
| Jun 10 | 10.46M | 11.53M | 12.61M |
| Jun 09 | 10.39M | 11.45M | 12.48M |
| Jun 08 | 10.33M | 11.36M | 12.36M |
| Jun 07 | 10.26M | 11.26M | 12.25M |
| Jun 06 | 10.18M | 11.15M | 12.13M |
| Jun 05 | 10.09M | 11.00M | 12.02M |
| Jun 04 | 9.99M | 10.87M | 11.93M |
| Jun 03 | 9.87M | 10.74M | 11.84M |
| Jun 02 | 9.75M | 10.64M | 11.74M |
| Jun 01 | 9.64M | 10.58M | 11.65M |
| May 31 | 9.53M | 10.54M | 11.56M |
| May 30 | 9.43M | 10.49M | 11.47M |
| May 29 | 9.36M | 10.43M | 11.37M |
| May 28 | 9.30M | 10.35M | 11.27M |
| May 27 | 9.23M | 10.27M | 11.17M |
| May 26 | 9.16M | 10.20M | 11.08M |
| May 25 | 9.09M | 10.14M | 10.99M |
| May 24 | 8.98M | 10.07M | 10.89M |
| May 23 | 8.86M | 10.01M | 10.79M |
| May 22 | 8.73M | 9.94M | 10.68M |
| May 21 | 8.61M | 9.85M | 10.57M |
| May 20 | 8.52M | 9.76M | 10.45M |
| May 19 | 8.43M | 9.66M | 10.33M |
| May 18 | 8.36M | 9.56M | 10.24M |
| May 17 | 8.30M | 9.46M | 10.14M |
| May 16 | 8.25M | 9.34M | 10.03M |
| May 15 | 8.16M | 9.20M | 9.92M |
| May 14 | 8.06M | 9.09M | 9.82M |
| May 13 | 7.96M | 8.99M | 9.69M |
| May 12 | 7.85M | 8.88M | 9.58M |
| May 11 | 7.72M | 8.77M | 9.46M |
| May 10 | 7.61M | 8.67M | 9.35M |
| May 09 | 7.50M | 8.55M | 9.23M |
| May 08 | 7.39M | 8.40M | 9.12M |
| May 07 | 7.28M | 8.26M | 9.00M |
| May 06 | 7.17M | 8.13M | 8.88M |
| May 05 | 7.06M | 8.02M | 8.77M |
| May 04 | 6.96M | 7.91M | 8.65M |
| May 03 | 6.86M | 7.80M | 8.52M |
| May 02 | 6.77M | 7.69M | 8.41M |
| May 01 | 6.66M | 7.59M | 8.29M |
| Apr 30 | 6.56M | 7.48M | 8.17M |
| Apr 29 | 6.48M | 7.35M | 8.06M |
| Apr 28 | 6.38M | 7.24M | 7.95M |
| Apr 27 | 6.28M | 7.12M | 7.83M |
| Apr 26 | 6.19M | 7.00M | 7.71M |
| Apr 25 | 6.09M | 6.86M | 7.59M |
| Apr 24 | 5.98M | 6.74M | 7.48M |
| Apr 23 | 5.89M | 6.62M | 7.37M |
| Apr 22 | 5.80M | 6.50M | 7.27M |
| Apr 21 | 5.71M | 6.39M | 7.18M |
| Apr 20 | 5.64M | 6.27M | 7.09M |
| Apr 19 | 5.59M | 6.15M | 6.99M |
| Apr 18 | 5.52M | 6.00M | 6.88M |
| Apr 17 | 5.45M | 5.86M | 6.78M |
| Apr 16 | 5.38M | 5.73M | 6.66M |
| Apr 15 | 5.30M | 5.59M | 6.55M |
| Apr 14 | 5.19M | 5.46M | 6.43M |
| Apr 13 | 5.10M | 5.33M | 6.31M |
| Apr 12 | 5.02M | 5.20M | 6.18M |
| Apr 11 | 4.94M | 5.09M | 6.06M |
| Apr 10 | 4.86M | 4.97M | 5.93M |
| Apr 09 | 4.79M | 4.86M | 5.81M |
| Apr 08 | 4.71M | 4.77M | 5.71M |
| Apr 07 | 4.63M | 4.68M | 5.62M |
| Apr 06 | 4.54M | 4.61M | 5.53M |
| Apr 05 | 4.46M | 4.52M | 5.44M |
| Apr 04 | 4.37M | 4.42M | 5.35M |
| Apr 03 | 4.26M | 4.31M | 5.27M |
| Apr 02 | 4.16M | 4.20M | 5.18M |
| Apr 01 | 4.04M | 4.06M | 5.11M |
| Mar 31 | 3.93M | 3.93M | 5.04M |
| Mar 30 | 3.86M | 3.81M | 4.97M |
| Mar 29 | 3.77M | 3.68M | 4.89M |
| Mar 28 | 3.68M | 3.54M | 4.81M |
| Mar 27 | 3.57M | 3.40M | 4.72M |
| Mar 26 | 3.44M | 3.28M | 4.63M |
| Mar 25 | 3.28M | 3.20M | 4.54M |
| Mar 24 | 3.14M | 3.12M | 4.46M |
| Mar 23 | 3.02M | 3.06M | 4.37M |
| Mar 22 | 2.92M | 3.01M | 4.28M |
| Mar 21 | 2.84M | 2.95M | 4.20M |
| Mar 20 | 2.78M | 2.88M | 4.12M |
| Mar 19 | 2.72M | 2.81M | 4.03M |
| Mar 18 | 2.66M | 2.74M | 3.95M |
| Mar 17 | 2.61M | 2.68M | 3.88M |
| Mar 16 | 2.55M | 2.62M | 3.80M |
| Mar 15 | 2.49M | 2.57M | 3.73M |
| Mar 14 | 2.44M | 2.52M | 3.65M |
| Mar 13 | 2.40M | 2.48M | 3.59M |
| Mar 12 | 2.34M | 2.43M | 3.51M |
| Mar 11 | 2.27M | 2.39M | 3.44M |
| Mar 10 | 2.21M | 2.34M | 3.37M |
| Mar 09 | 2.13M | 2.29M | 3.31M |
| Mar 08 | 2.04M | 2.24M | 3.25M |
| Mar 07 | 1.97M | 2.19M | 3.20M |
| Mar 06 | 1.93M | 2.15M | 3.16M |
| Mar 05 | 1.91M | 2.11M | 3.12M |
| Mar 04 | 1.89M | 2.07M | 3.07M |
| Mar 03 | 1.88M | 2.03M | 3.02M |
| Mar 02 | 1.87M | 2.01M | 2.98M |
| Mar 01 | 1.85M | 1.99M | 2.94M |
| Feb 28 | 1.83M | 1.98M | 2.89M |
| Feb 27 | 1.83M | 1.98M | 2.86M |
| Feb 26 | 1.82M | 1.98M | 2.83M |
| Feb 25 | 1.82M | 1.98M | 2.81M |
| Feb 24 | 1.81M | 1.98M | 2.81M |
| Feb 23 | 1.80M | 1.99M | 2.81M |
| Feb 22 | 1.79M | 1.99M | 2.81M |
| Feb 21 | 1.79M | 2.02M | 2.81M |
| Feb 20 | 1.81M | 2.03M | 2.82M |
| Feb 19 | 1.82M | 2.05M | 2.82M |
| Feb 18 | 1.85M | 2.08M | 2.84M |
| Feb 17 | 1.86M | 2.11M | 2.86M |
| Feb 16 | 1.88M | 2.14M | 2.89M |
| Feb 15 | 1.88M | 2.18M | 2.93M |
| Feb 14 | 1.89M | 2.22M | 2.97M |
| Feb 13 | 1.91M | 2.24M | 3.02M |
| Feb 12 | 1.93M | 2.26M | 3.06M |
| Feb 11 | 1.96M | 2.31M | 3.10M |
| Feb 10 | 1.98M | 2.35M | 3.15M |
| Feb 09 | 2.01M | 2.41M | 3.20M |
| Feb 08 | 2.03M | 2.47M | 3.25M |
| Feb 07 | 2.06M | 2.54M | 3.30M |
| Feb 06 | 2.09M | 2.60M | 3.36M |
| Feb 05 | 2.12M | 2.66M | 3.41M |
| Feb 04 | 2.16M | 2.71M | 3.47M |
| Feb 03 | 2.19M | 2.77M | 3.52M |
| Feb 02 | 2.23M | 2.82M | 3.57M |
| Feb 01 | 2.26M | 2.86M | 3.63M |
| Jan 31 | 2.30M | 2.89M | 3.68M |
| Jan 30 | 2.35M | 2.94M | 3.73M |
| Jan 29 | 2.42M | 2.99M | 3.78M |
| Jan 28 | 2.48M | 3.04M | 3.84M |
| Jan 27 | 2.56M | 3.11M | 3.89M |
| Jan 26 | 2.65M | 3.19M | 3.96M |
| Jan 25 | 2.71M | 3.26M | 4.04M |
| Jan 24 | 2.78M | 3.34M | 4.12M |
| Jan 23 | 2.85M | 3.41M | 4.18M |
| Jan 22 | 2.90M | 3.48M | 4.26M |
| Jan 21 | 2.96M | 3.57M | 4.34M |
| Jan 20 | 3.02M | 3.66M | 4.42M |
| Jan 19 | 3.09M | 3.75M | 4.51M |
| Jan 18 | 3.17M | 3.87M | 4.62M |
| Jan 17 | 3.24M | 3.96M | 4.73M |
| Jan 16 | 3.32M | 4.05M | 4.87M |
| Jan 15 | 3.39M | 4.13M | 5.01M |
| Jan 14 | 3.45M | 4.20M | 5.14M |
| Jan 13 | 3.51M | 4.27M | 5.27M |
| Jan 12 | 3.59M | 4.38M | 5.41M |
| Jan 11 | 3.67M | 4.49M | 5.54M |
| Jan 10 | 3.76M | 4.59M | 5.69M |
| Jan 09 | 3.86M | 4.70M | 5.85M |
| Jan 08 | 3.97M | 4.83M | 6.02M |
| Jan 07 | 4.09M | 4.95M | 6.18M |
| Jan 06 | 4.22M | 5.09M | 6.34M |
| Jan 05 | 4.35M | 5.27M | 6.51M |
| Jan 04 | 4.49M | 5.45M | 6.67M |
| Jan 03 | 4.64M | 5.62M | 6.84M |
| Jan 02 | 4.79M | 5.82M | 7.01M |
| Jan 01 | 5.00M | 6.02M | 7.19M |
Antarctica’s sea ice extent on August 24, 2023 was 1.42 million square kilometers smaller than the year before. When compared to the median extent for that date from 1980 to 2010, it was 2.07 million square kilometers smaller.
Keep in mind that July and August are the coldest months in Antarctica. Its position on the South Pole gives it a very long winter ranging from the end of February to the end of September, with ice building up before melting temperatures arrive in October.
Antarctica Sea Ice and the Rest of the World
Even though the continent is thousands of kilometers from most of Earth’s land and populace, its ice has an important impact on the rest of the planet.
Antarctica’s large ice sheet is able to reflect a lot of sunlight in sunnier months, reducing the amount absorbed by the ocean. The wider its extent builds up over the winter, the more sunlight and heat it is able to reflect.
It’s also important to consider that this ice comes from a regular pattern of freezing and melting ocean water. The more ice is lost to the oceans compared to what accumulates in a given year, the higher sea levels rise around the world.

-

 Wealth6 days ago
Charted: Which City Has the Most Billionaires in 2024?
-

 Mining2 weeks ago
Gold vs. S&P 500: Which Has Grown More Over Five Years?
-

 Uranium2 weeks ago
The World’s Biggest Nuclear Energy Producers
-

 Education2 weeks ago
How Hard Is It to Get Into an Ivy League School?
-

 Debt2 weeks ago
How Debt-to-GDP Ratios Have Changed Since 2000
-

 Sports2 weeks ago
The Highest Earning Athletes in Seven Professional Sports
-

 Science2 weeks ago
Visualizing the Average Lifespans of Mammals
-

 Brands1 week ago
How Tech Logos Have Evolved Over Time