Green
Visualizing the Impact of Rising Sea Levels, by Country
Article/Editing:
Climate change is already causing sea levels to rise across the globe. In the 20th century alone, it’s estimated that the mean global sea level rose by 11-16 cm.
How much will sea levels change in the coming years, and how will it affect our population?
In the below series of visualizations by Florent Lavergne, we can see how rising sea levels could impact countries in terms of flood risk by the year 2100.
These graphics use data from a 2019 study by Scott Kulp and Benjamin Strauss. Their study used CoastalDEM—a 3D graphics tool used to measure a population’s potential exposure to extreme coastal water levels—and examined rising sea levels under different levels of greenhouse gas (GHG) emissions.
Flood Risk By Region
Which countries will be most severely affected by rising sea levels?
If things continue as they are, roughly 360 million people around the world could be at risk of annual flood events by 2100. Here’s what those figures look like across each region:
Africa
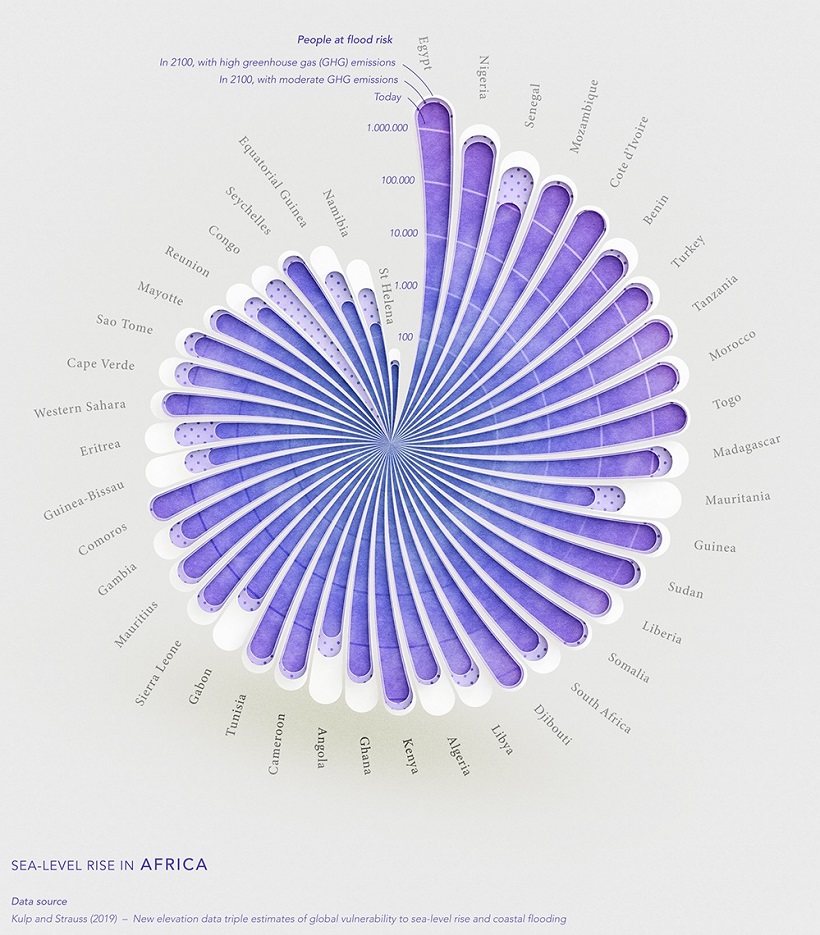
On the continent of Africa, one of the countries with the highest number of people at risk of coastal flooding is Egypt.
Over 95% of Egypt’s population lives along the Nile river, with some areas situated at extremely low elevations. The country’s lowest point is 133 m below sea level.
Asia
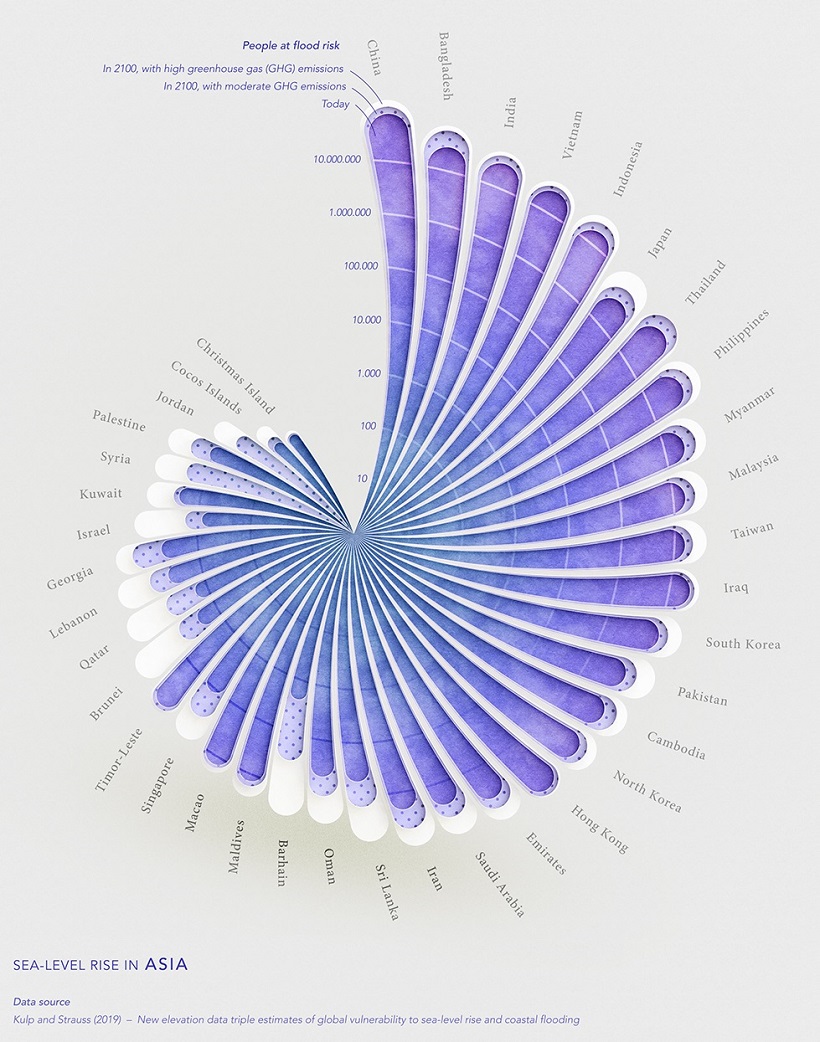
Asia’s population will be more heavily impacted by flooding than any other region included in the dataset.
According to the projections, 70% of the people that will be affected by rising sea levels are located in just eight Asian countries: China, Bangladesh, India, Vietnam, Indonesia, Thailand, the Philippines, and Japan.
Europe

One of the most high-risk populations in Europe is the Netherlands. The country has a population of about 17 million, and as of 2019, about half of its population lives in areas below sea level.
The country’s lowest point, the town Nieuwekerk aan den Ijssel, is 6.8 m below sea level.
North America
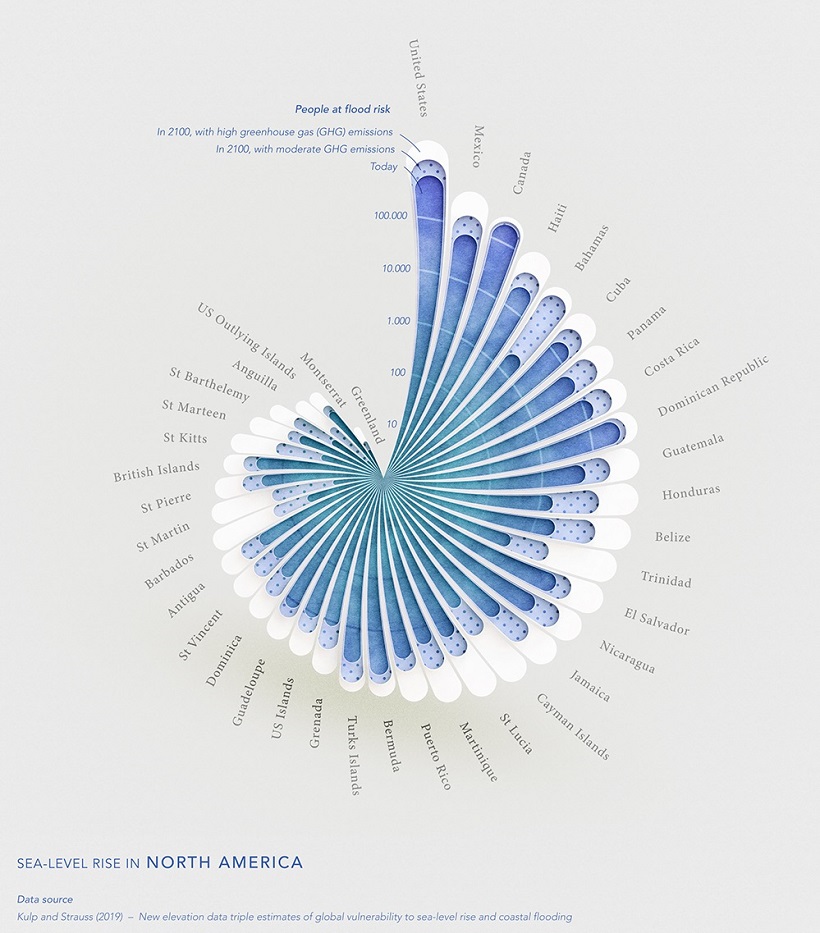
In North America, the U.S., Canada, and Mexico are expected to see the highest numbers of impacted people, due to the size of their populations.
But as a percentage of population, other countries in Central America and the Caribbean are more greatly at risk, especially in high emission scenarios. One country worth highlighting is the Bahamas. Even based on moderate emission levels, the country is expected to see a significant surge in the number of people at risk of flood.
According to the World Bank, this is because land in the Bahamas is relatively flat, making the island especially vulnerable to sea level rises and flooding.
South America
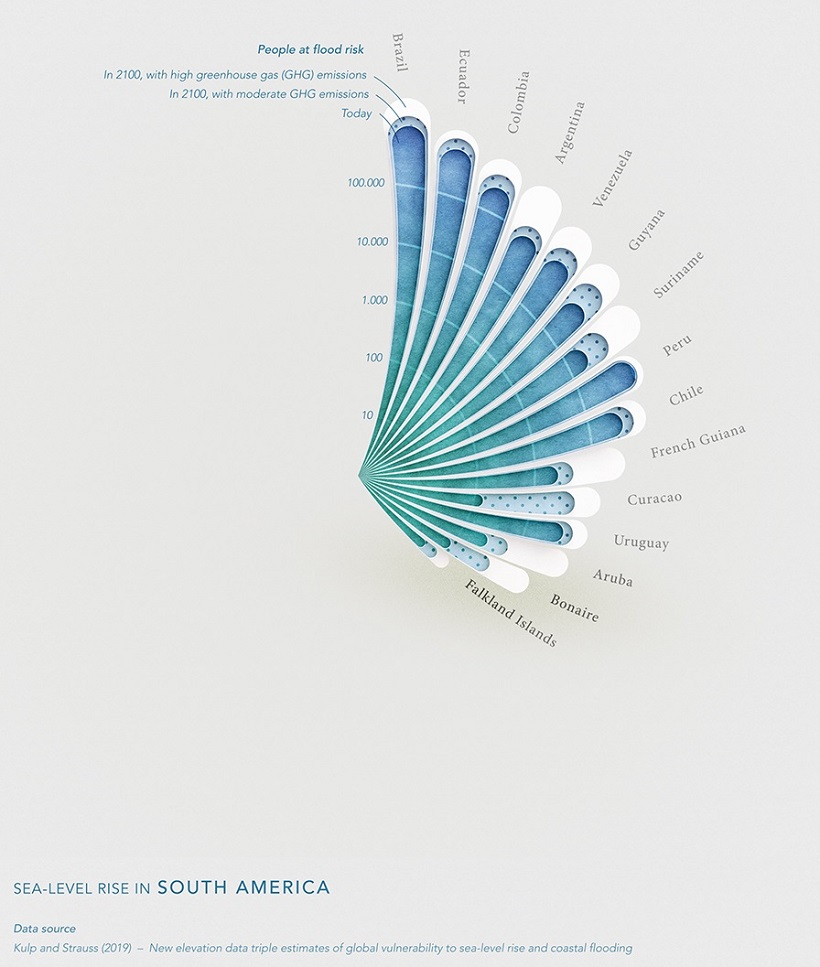
As South America’s largest country by population and with large coastal cities, Brazil‘s population is the most at risk for flood caused by rising sea levels.
Notably, thanks to a lot of mountainous terrain and municipalities situated on high elevation, no country in South America faces a flood risk impacting more than 1 million people.
Oceania
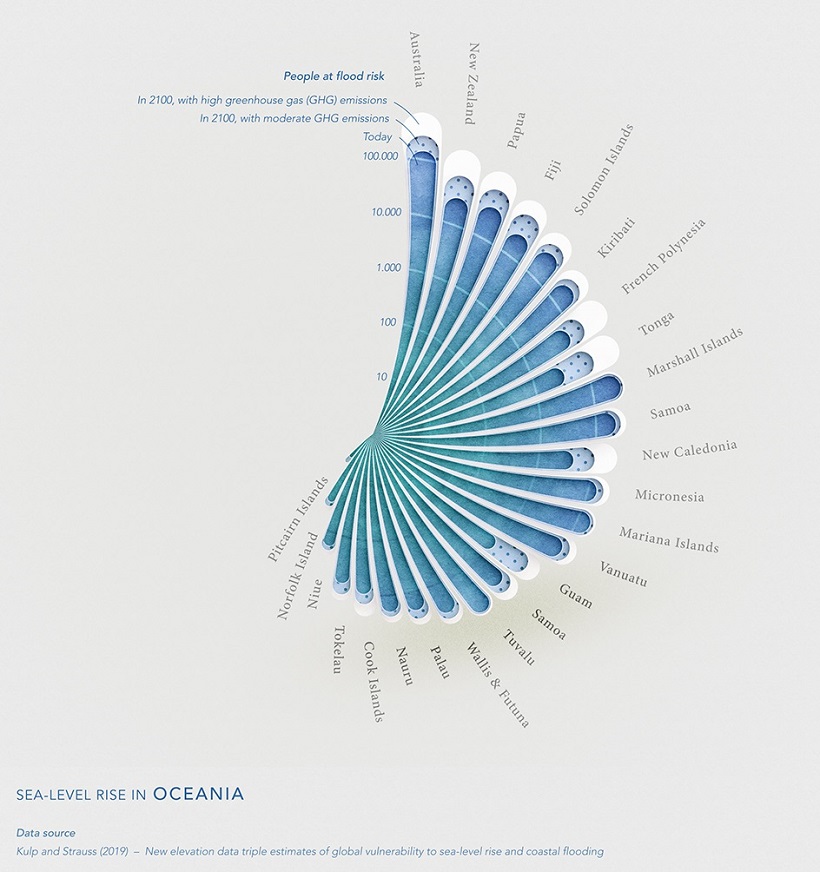
By 2100, Polynesian countries like Tonga are projected to see massive increases in the number of people at risk of flooding, even at moderate GHG emissions.
According to Reuters, sea levels in Tonga have been rising by 6 mm each year, which is nearly double the average global rate. The reason for this is because the islands sit in warmer waters, where sea level changes are more noticeable than at the poles.
What’s Causing Sea Levels to Rise?
Since 1975, average temperatures around the world have risen 0.15 to 0.20°C each decade, according to research by NASA.
This global heating has caused polar ice caps to begin melting—in just over two decades, we’ve lost roughly 28 trillion tonnes of our world’s ice. Over that same timeframe, global sea levels have risen by an average of 36 mm. These rising sea levels pose a number of risks, including soil contamination, loss of habitat, and flooding.
As countries are affected by climate change in different ways, and at different levels, the question becomes how they will respond in turn.


This article was published as a part of Visual Capitalist's Creator Program, which features data-driven visuals from some of our favorite Creators around the world.


Green
Ranking the Top 15 Countries by Carbon Tax Revenue
This graphic highlights France and Canada as the global leaders when it comes to generating carbon tax revenue.


Top 15 Countries by Carbon Tax Revenue
This was originally posted on our Voronoi app. Download the app for free on iOS or Android and discover incredible data-driven charts from a variety of trusted sources.
Carbon taxes are designed to discourage CO2 emissions by increasing the cost of carbon-intensive activities and incentivizing the adoption of cleaner energy alternatives.
In this graphic we list the top 15 countries by carbon tax revenue as of 2022. The data is from the World Bank’s State and Trends of Carbon Pricing Report, published in April 2023.
France and Canada Lead in Global Carbon Tax Revenue
In 2022, the top 15 countries generated approximately $30 billion in revenue from carbon taxes.
France and Canada lead in this regard, accounting for over half of the total amount. Both countries have implemented comprehensive carbon pricing systems that cover a wide range of sectors, including transportation and industry, and they have set relatively high carbon tax rates.
| Country | Government revenue in 2022 ($ billions) |
|---|---|
| 🇫🇷 France | $8.9 |
| 🇨🇦 Canada | $7.8 |
| 🇸🇪 Sweden | $2.3 |
| 🇳🇴 Norway | $2.1 |
| 🇯🇵 Japan | $1.8 |
| 🇫🇮 Finland | $1.7 |
| 🇨🇭 Switzerland | $1.6 |
| 🇬🇧 United Kingdom | $0.9 |
| 🇮🇪 Ireland | $0.7 |
| 🇩🇰 Denmark | $0.5 |
| 🇵🇹 Portugal | $0.5 |
| 🇦🇷 Argentina | $0.3 |
| 🇲🇽 Mexico | $0.2 |
| 🇸🇬 Singapore | $0.1 |
| 🇿🇦 South Africa | $0.1 |
In Canada, the total carbon tax revenue includes both national and provincial taxes.
While carbon pricing has been recognized internationally as one of the more efficient mechanisms for reducing CO2 emissions, research is divided over what the global average carbon price should be to achieve the goals of the Paris Climate Agreement, which aims to limit global warming to 1.5–2°C by 2100 relative to pre-industrial levels.
A recent study has shown that carbon pricing must be supported by other policy measures and innovations. According to a report from Queen’s University, there is no feasible carbon pricing scenario that is high enough to limit emissions sufficiently to achieve anything below 2.4°C warming on its own.

-

 Markets1 week ago
U.S. Debt Interest Payments Reach $1 Trillion
-

 Markets2 weeks ago
Ranked: The Most Valuable Housing Markets in America
-

 Money2 weeks ago
Which States Have the Highest Minimum Wage in America?
-

 AI2 weeks ago
Ranked: Semiconductor Companies by Industry Revenue Share
-

 Markets2 weeks ago
Ranked: The World’s Top Flight Routes, by Revenue
-

 Countries2 weeks ago
Population Projections: The World’s 6 Largest Countries in 2075
-

 Markets2 weeks ago
The Top 10 States by Real GDP Growth in 2023
-

 Money2 weeks ago
The Smallest Gender Wage Gaps in OECD Countries