Antarctica's ice extent has reached record lows. This visual details and maps Antarctica sea ice loss over the last two...
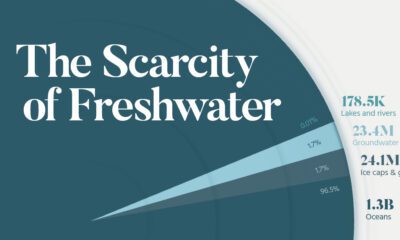

See all of the world's water in one chart, as well as which regions will suffer the greatest from water scarcity.
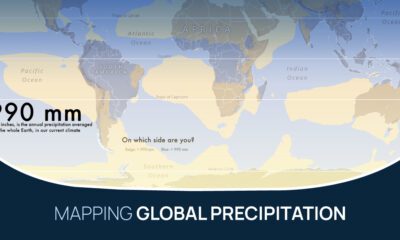

What does the global precipitation map look like if we split it in two, one half with below average rainfall and the other above?
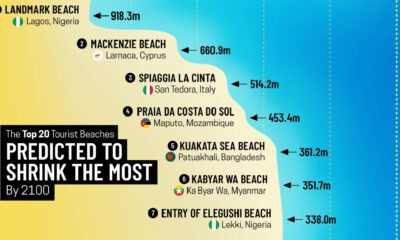

Sandy beaches make up over one-third of the world's coastline, yet nearly half of them could disappear by 2100.


This chart highlights the different countries, and the number of people, facing water security issues around the world.
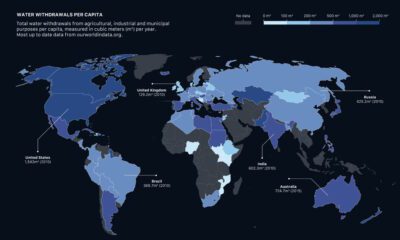

How much water do we have, and which countries use the most? This visual breaks down global water distribution and withdrawals by countries.
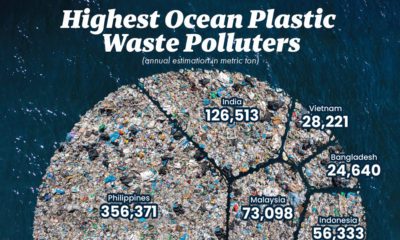

This graphic visualizes the top 10 countries emitting plastic pollutants into our oceans.
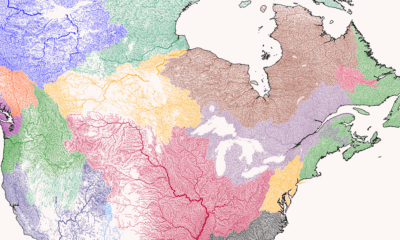

Where does each river start, converge, and end? This series of maps traces river basins in each continent around the world.


This new planet-wide animated map, based on a decade of space agency research, shows where water can be found on Mars.


Recent floods in Pakistan have affected more than 33 million people. Where is the risk of flooding highest around the world?


 Creator Program