Maps
Mapping the Unequal Distribution of Global Precipitation
Article/Editing:
Click to view this graphic in a higher-resolution.
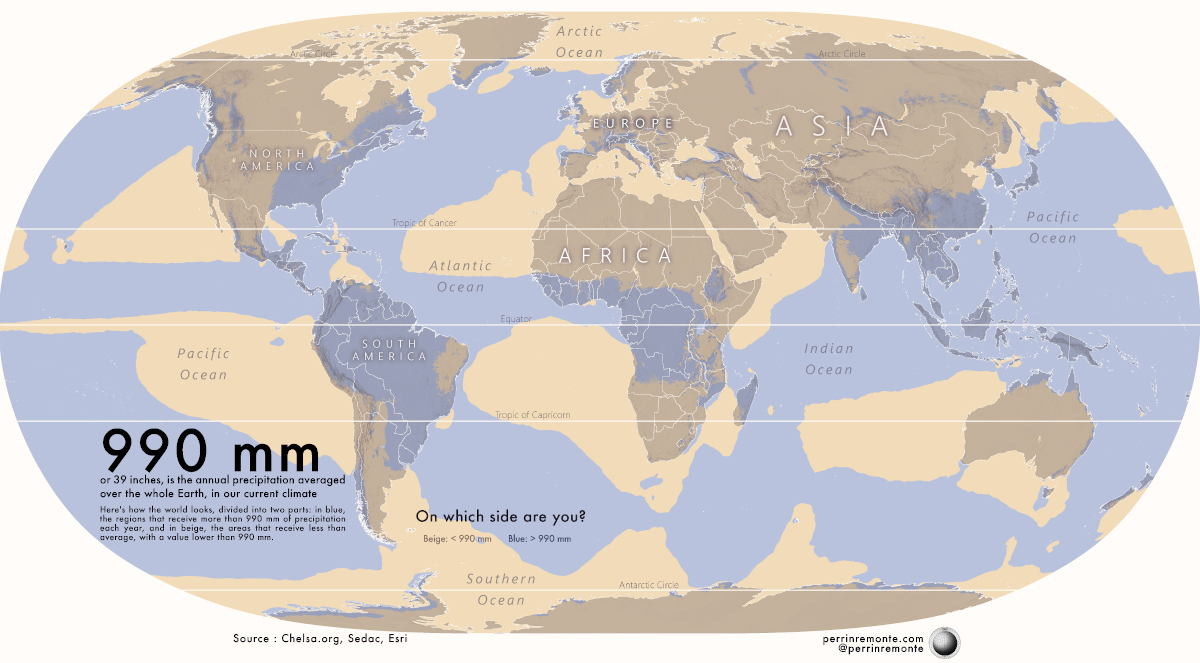
Mapping the Unequal Distribution of Global Precipitation
On average, nearly one meter (39 inches) of rain or snow falls on the Earth in a year. However, differences in latitude, winds, changes in the Earth’s surface, and the planet’s tilt, make for an unequal distribution of global precipitation.
Cartographer Perrin Remonté uses data from Chelsea Climate to visualize this by splitting the world in two. One half, in blue, receives more than one meter of rain (or snow) in a year, the other half receives less.
What Affects Global Precipitation Patterns?
From the water cycle we know that precipitation starts with evaporation. However, moist air needs to cool and then condense to come down as rain (or snow). Below we list some major factors influencing precipitation.
- Proximity to water: Oceans and lakes provide a constant source of moisture.
- Lower latitudes: Areas at, or close to the equator, are hotter and this can increase evaporation from nearby water bodies.
- Topography: Mountain ranges, especially along coasts, force warm air to rise and cool, resulting in rain or snow on the windward side and dry rain shadows on the lee side.
- Trade winds: Persistent, easterly surface winds blow from subtropical high-pressure areas toward the equator, carrying moist air from the ocean to the land.
So, how do these factors interact to form the global precipitation map visualized above?
Ranked: Countries Which Receive Highest Rain or Snow
A quick look at the map reveals some obvious insights. For one, most of the Earth that receives above average rainfall is covered by oceans. After all, oceans are 71% of the Earth’s surface, but, crucially, they provide the moisture for precipitation to occur.
Over landmasses, we see more complex interaction between earlier listed factors. Here’s the average rainfall received by each country in 2020, sourced from the World Bank.
| Rank | Country/Territory | Average Precipitation (mm, 2020) |
|---|---|---|
| 1 | 🇨🇴 Colombia | 3,240 |
| 2 | 🇸🇹 Sao Tome & Principe | 3,200 |
| 3 | 🇵🇬 Papua New Guinea | 3,142 |
| 4 | 🇸🇧 Solomon Islands | 3,028 |
| 5 | 🇵🇦 Panama | 2,928 |
| 6 | 🇨🇷 Costa Rica | 2,926 |
| 7 | 🇼🇸 Samoa | 2,880 |
| 8 | 🇲🇾 Malaysia | 2,875 |
| 9 | 🇧🇳 Brunei Darussalam | 2,722 |
| 10 | 🇮🇩 Indonesia | 2,702 |
| 11 | 🇧🇩 Bangladesh | 2,666 |
| 12 | 🇫🇯 Fiji | 2,592 |
| 13 | 🇸🇱 Sierra Leone | 2,526 |
| 14 | 🇸🇬 Singapore | 2,497 |
| 15 | 🇱🇷 Liberia | 2,391 |
| 16 | 🇬🇾 Guyana | 2,387 |
| 17 | 🇬🇩 Grenada | 2,350 |
| 18 | 🇵🇭 Philippines | 2,348 |
| 19 | 🇸🇷 Suriname | 2,331 |
| 20 | 🇸🇨 Seychelles | 2,330 |
| 21 | 🇱🇨 St. Lucia | 2,301 |
| 22 | 🇳🇮 Nicaragua | 2,280 |
| 23 | 🇪🇨 Ecuador | 2,274 |
| 24 | 🇧🇹 Bhutan | 2,200 |
| 25 | 🇹🇹 Trinidad & Tobago | 2,200 |
| 26 | 🇬🇶 Equatorial Guinea | 2,156 |
| 27 | 🇲🇲 Myanmar | 2,091 |
| 28 | 🇩🇲 Dominica | 2,083 |
| 29 | 🇵🇷 Puerto Rico | 2,054 |
| 30 | 🇯🇲 Jamaica | 2,051 |
| 31 | 🇻🇪 Venezuela | 2,044 |
| 32 | 🇲🇺 Mauritius | 2,041 |
| 33 | 🇻🇺 Vanuatu | 2,000 |
| 34 | 🇬🇹 Guatemala | 1,996 |
| 35 | 🇭🇳 Honduras | 1,976 |
| 36 | 🇲🇻 Maldives | 1,972 |
| 37 | 🇮🇸 Iceland | 1,940 |
| 38 | 🇰🇭 Cambodia | 1,904 |
| 39 | 🇱🇦 Laos | 1,834 |
| 40 | 🇬🇦 Gabon | 1,831 |
| 41 | 🇻🇳 Viet Nam | 1,821 |
| 42 | 🇸🇻 El Salvador | 1,784 |
| 43 | 🇧🇷 Brazil | 1,761 |
| 44 | 🇵🇪 Peru | 1,738 |
| 45 | 🇳🇿 New Zealand | 1,732 |
| 46 | 🇱🇰 Sri Lanka | 1,712 |
| 47 | 🇧🇿 Belize | 1,705 |
| 48 | 🇯🇵 Japan | 1,668 |
| 49 | 🇬🇳 Guinea | 1,651 |
| 50 | 🇨🇬 Congo | 1,646 |
| 51 | 🇹🇭 Thailand | 1,622 |
| 52 | 🇨🇲 Cameroon | 1,604 |
| 53 | 🇻🇨 St. Vincent & the Grenadines | 1,583 |
| 54 | 🇬🇼 Guinea-Bissau | 1,577 |
| 55 | 🇨🇩 DRC | 1,543 |
| 56 | 🇨🇭 Switzerland | 1,537 |
| 57 | 🇨🇱 Chile | 1,522 |
| 58 | 🇲🇬 Madagascar | 1,513 |
| 59 | 🇳🇵 Nepal | 1,500 |
| 60 | 🇹🇱 Timor-Leste | 1,500 |
| 61 | 🇦🇱 Albania | 1,485 |
| 62 | 🇭🇹 Haiti | 1,440 |
| 63 | 🇰🇳 St. Kitts & Nevis | 1,427 |
| 64 | 🇧🇧 Barbados | 1,422 |
| 65 | 🇳🇴 Norway | 1,414 |
| 66 | 🇩🇴 Dominican Republic | 1,410 |
| 67 | 🇨🇮 Cote d'Ivoire | 1,348 |
| 68 | 🇨🇫 Central African Republic | 1,343 |
| 69 | 🇨🇺 Cuba | 1,335 |
| 70 | 🇺🇾 Uruguay | 1,300 |
| 71 | 🇧🇸 Bahamas | 1,292 |
| 72 | 🇧🇮 Burundi | 1,274 |
| 73 | 🇰🇷 South Korea | 1,274 |
| 74 | 🇬🇧 UK | 1,220 |
| 75 | 🇷🇼 Rwanda | 1,212 |
| 76 | 🇬🇭 Ghana | 1,187 |
| 77 | 🇲🇼 Malawi | 1,181 |
| 78 | 🇺🇬 Uganda | 1,180 |
| 79 | 🇹🇬 Togo | 1,168 |
| 80 | 🇸🇮 Slovenia | 1,162 |
| 81 | 🇳🇬 Nigeria | 1,150 |
| 82 | 🇧🇴 Bolivia | 1,146 |
| 83 | 🇵🇾 Paraguay | 1,130 |
| 84 | 🇮🇪 Ireland | 1,118 |
| 85 | 🇭🇷 Croatia | 1,113 |
| 86 | 🇦🇹 Austria | 1,110 |
| 87 | 🇮🇳 India | 1,083 |
| 88 | 🇹🇿 Tanzania | 1,071 |
| 89 | 🇰🇵 North Korea | 1,054 |
| 90 | 🇧🇯 Benin | 1,039 |
| 91 | 🇲🇿 Mozambique | 1,032 |
| 92 | 🇦🇬 Antigua & Barbuda | 1,030 |
| 93 | 🇧🇦 Bosnia & Herzegovina | 1,028 |
| 94 | 🇬🇪 Georgia | 1,026 |
| 95 | 🇿🇲 Zambia | 1,020 |
| 96 | 🇦🇴 Angola | 1,010 |
| 97 | 🇱🇺 Luxembourg | 934 |
| 98 | 🇰🇲 Comoros | 900 |
| 99 | 🇸🇸 South Sudan | 900 |
| 100 | 🇫🇷 France | 867 |
| 101 | 🇵🇹 Portugal | 854 |
| 102 | 🇪🇹 Ethiopia | 848 |
| 103 | 🇧🇪 Belgium | 847 |
| 104 | 🇬🇲 Gambia | 836 |
| 105 | 🇮🇹 Italy | 832 |
| 106 | 🇸🇰 Slovakia | 824 |
| 107 | 🇱🇸 Lesotho | 788 |
| 108 | 🇸🇿 Eswatini | 788 |
| 109 | 🇳🇱 Netherlands | 778 |
| 110 | 🇲🇽 Mexico | 758 |
| 111 | 🇧🇫 Burkina Faso | 748 |
| 112 | 🇺🇸 U.S. | 715 |
| 113 | 🇩🇰 Denmark | 703 |
| 114 | 🇩🇪 Germany | 700 |
| 115 | 🇹🇯 Tajikistan | 691 |
| 116 | 🇸🇳 Senegal | 686 |
| 117 | 🇨🇿 Czechia | 677 |
| 118 | 🇱🇻 Latvia | 667 |
| 119 | 🇱🇧 Lebanon | 661 |
| 120 | 🇿🇼 Zimbabwe | 657 |
| 121 | 🇱🇹 Lithuania | 656 |
| 122 | 🇬🇷 Greece | 652 |
| 123 | 🇨🇳 China | 645 |
| 124 | 🇷🇴 Romania | 637 |
| 125 | 🇪🇸 Spain | 636 |
| 126 | 🇰🇪 Kenya | 630 |
| 127 | 🇪🇪 Estonia | 626 |
| 128 | 🇸🇪 Sweden | 624 |
| 129 | 🇲🇰 North Macedonia | 619 |
| 130 | 🇧🇾 Belarus | 618 |
| 131 | 🇧🇬 Bulgaria | 608 |
| 132 | 🇵🇱 Poland | 600 |
| 133 | 🇹🇷 Türkiye | 593 |
| 134 | 🇦🇷 Argentina | 591 |
| 135 | 🇭🇺 Hungary | 589 |
| 136 | 🇺🇦 Ukraine | 565 |
| 137 | 🇦🇲 Armenia | 562 |
| 138 | 🇲🇹 Malta | 560 |
| 139 | 🇨🇦 Canada | 537 |
| 140 | 🇫🇮 Finland | 536 |
| 141 | 🇦🇺 Australia | 534 |
| 142 | 🇰🇬 Kyrgyz Republic | 533 |
| 143 | 🇨🇾 Cyprus | 498 |
| 144 | 🇿🇦 South Africa | 495 |
| 145 | 🇵🇰 Pakistan | 494 |
| 146 | 🇷🇺 Russia | 460 |
| 147 | 🇲🇩 Moldova | 450 |
| 148 | 🇦🇿 Azerbaijan | 447 |
| 149 | 🇮🇱 Israel | 435 |
| 150 | 🇧🇼 Botswana | 416 |
| 151 | 🇵🇸 West Bank & Gaza | 402 |
| 152 | 🇪🇷 Eritrea | 384 |
| 153 | 🇲🇦 Morocco | 346 |
| 154 | 🇦🇫 Afghanistan | 327 |
| 155 | 🇹🇩 Chad | 322 |
| 156 | 🇳🇦 Namibia | 285 |
| 157 | 🇲🇱 Mali | 282 |
| 158 | 🇸🇴 Somalia | 282 |
| 159 | 🇸🇾 Syria | 252 |
| 160 | 🇰🇿 Kazakhstan | 250 |
| 161 | 🇸🇩 Sudan | 250 |
| 162 | 🇲🇳 Mongolia | 241 |
| 163 | 🇨🇻 Cabo Verde | 228 |
| 164 | 🇮🇷 Iran | 228 |
| 165 | 🇩🇯 Djibouti | 220 |
| 166 | 🇮🇶 Iraq | 216 |
| 167 | 🇹🇳 Tunisia | 207 |
| 168 | 🇺🇿 Uzbekistan | 206 |
| 169 | 🇾🇪 Yemen | 167 |
| 170 | 🇹🇲 Turkmenistan | 161 |
| 171 | 🇳🇪 Niger | 151 |
| 172 | 🇴🇲 Oman | 125 |
| 173 | 🇰🇼 Kuwait | 121 |
| 174 | 🇯🇴 Jordan | 111 |
| 175 | 🇲🇷 Mauritania | 92 |
| 176 | 🇩🇿 Algeria | 89 |
| 177 | 🇧🇭 Bahrain | 83 |
| 178 | 🇦🇪 UAE | 78 |
| 179 | 🇶🇦 Qatar | 74 |
| 180 | 🇸🇦 Saudi Arabia | 59 |
| 181 | 🇱🇾 Libya | 56 |
| 182 | 🇪🇬 Egypt | 18 |
Note: Data for 34 countries/territories is missing from the source and has not been included in this dataset.
At the top of the list Colombia experienced 3,240 millimeters (125.8 inches) of rain in 2020. This is due to its equatorial location, proximity to the Intertropical Convergence Zone (where trade winds from both hemispheres meet), two coastlines, and the presence of the Andes mountain range.
In fact, the next 22 ranks are countries that lie at or near the equator or have significant coastlines that lead to higher than average rainfall.
Bhutan, ranked 24th with 2,200 mm (86.6 inches) of rain is the first completely landlocked country in the dataset. Despite this, the country is on the path of the southwest monsoon (a seasonal wind laden with moisture) originating in the Indian Ocean, which encounters the windward side of Himalayas, causing rainfall.
In many countries like India, China, and the U.S., the coasts receive above average rainfall compared to the landlocked regions inside the countries.
However, countries in North Africa, like Egypt and Libya, are arid despite their coasts. High-pressure weather systems prevent moist air from rising, mountains cause rain shadows, and cold ocean currents reduce the chance of steady evaporation. Additionally, the region is in the 30 degree latitude band around the equator where atmospheric conditions cause drier conditions, leading to deserts.
What Does Mapping Global Precipitation Tell Us?
Knowing rain and snow patterns is critical for scientists studying the Earth’s climate system, as it reveals the impact of factors like geography, topography, and ocean currents on local climes.
It also aids in short-term weather forecasting, predicting when and where rain or snow may occur.
Practically, this data helps in water management, monitoring drought and flood conditions, enabling quick responses to extreme weather events.
Where Does This Data Come From?
Sources: Climate data from Chelsea Climate, and precipitation data from the World Bank.
Note: The precipitation data from the World Bank is collected by the Food and Agriculture Organization of the United Nations (FAO) through annual questionnaires. Complete consistency across countries and over time is not possible.

This article was published as a part of Visual Capitalist's Creator Program, which features data-driven visuals from some of our favorite Creators around the world.


Maps
The Largest Earthquakes in the New York Area (1970-2024)
The earthquake that shook buildings across New York in April 2024 was the third-largest quake in the Northeast U.S. over the past 50 years.


The Largest Earthquakes in the New York Area
This was originally posted on our Voronoi app. Download the app for free on Apple or Android and discover incredible data-driven charts from a variety of trusted sources.
The 4.8 magnitude earthquake that shook buildings across New York on Friday, April 5th, 2024 was the third-largest quake in the U.S. Northeast area over the past 50 years.
In this map, we illustrate earthquakes with a magnitude of 4.0 or greater recorded in the Northeastern U.S. since 1970, according to the United States Geological Survey (USGS).
Shallow Quakes and Older Buildings
The earthquake that struck the U.S. Northeast in April 2024 was felt by millions of people from Washington, D.C., to north of Boston. It even caused a full ground stop at Newark Airport.
The quake, occurring just 5 km beneath the Earth’s surface, was considered shallow, which is what contributed to more intense shaking at the surface.
According to the USGS, rocks in the eastern U.S. are significantly older, denser, and harder than those on the western side, compressed by time. This makes them more efficient conduits for seismic energy. Additionally, buildings in the Northeast tend to be older and may not adhere to the latest earthquake codes.
Despite disrupting work and school life, the earthquake was considered minor, according to the Michigan Technological University magnitude scale:
| Magnitude | Earthquake Effects | Estimated Number Each Year |
|---|---|---|
| 2.5 or less | Usually not felt, but can be recorded by seismograph. | Millions |
| 2.5 to 5.4 | Often felt, but only causes minor damage. | 500,000 |
| 5.5 to 6.0 | Slight damage to buildings and other structures. | 350 |
| 6.1 to 6.9 | May cause a lot of damage in very populated areas. | 100 |
| 7.0 to 7.9 | Major earthquake. Serious damage. | 10-15 |
| 8.0 or greater | Great earthquake. Can totally destroy communities near the epicenter. | One every year or two |
The largest earthquake felt in the area over the past 50 years was a 5.3 magnitude quake that occurred in Au Sable Forks, New York, in 2002. It damaged houses and cracked roads in a remote corner of the Adirondack Mountains, but caused no injuries.
| Date | Magnitude | Location | State |
|---|---|---|---|
| April 20, 2002 | 5.3 | Au Sable Forks | New York |
| October 7, 1983 | 5.1 | Newcomb | New York |
| April 5, 2024 | 4.8 | Whitehouse Station | New Jersey |
| October 16, 2012 | 4.7 | Hollis Center | Maine |
| January 16, 1994 | 4.6 | Sinking Spring | Pennsylvania |
| January 19, 1982 | 4.5 | Sanbornton | New Hampshire |
| September 25, 1998 | 4.5 | Adamsville | Pennsylvania |
| June 9, 1975 | 4.2 | Altona | New York |
| May 29, 1983 | 4.2 | Peru | Maine |
| April 23, 1984 | 4.2 | Conestoga | Pennsylvania |
| January 16, 1994 | 4.2 | Sinking Spring | Pennsylvania |
| November 3, 1975 | 4 | Long Lake | New York |
| June 17, 1991 | 4 | Worcester | New York |
The largest earthquake in U.S. history, however, was the 1964 Good Friday quake in Alaska, measuring 9.2 magnitude and killing 131 people.

-

 Culture1 week ago
The Highest Earning Athletes in Seven Professional Sports
-

 Demographics2 weeks ago
Population Projections: The World’s 6 Largest Countries in 2075
-

 Markets2 weeks ago
The Top 10 States by Real GDP Growth in 2023
-

 Demographics2 weeks ago
The Smallest Gender Wage Gaps in OECD Countries
-

 United States2 weeks ago
Where U.S. Inflation Hit the Hardest in March 2024
-

 Green2 weeks ago
Top Countries By Forest Growth Since 2001
-

 United States2 weeks ago
Ranked: The Largest U.S. Corporations by Number of Employees
-

 Maps2 weeks ago
The Largest Earthquakes in the New York Area (1970-2024)